I am often asked how to measure pitting and repassivation potentials (EP and ERP, respectively) when analyzing real, rather than idealized, anodic polarization plots. In fact, a quick look at how new visitors come to my blog revealed search queries such as “measure pitting potentials”, “what is repassivation potential”, “pitting potential anodic polarization”, etc. Thus, I decided to summarize the different approaches presented in the literature to determine EP, ERP, and transpassive potentials (ETrans) using a number of examples taken from actual polarization plots. For more information, I strongly recommend checking the sources listed in the Reference section.
No crevice corrosion
A quick, albeit very important, observation before jumping into the different examples: to assure EP corresponds to pitting corrosion initiation rather than crevice attack, it is critical to confirm the absence of crevice corrosion after each test and before analyzing the curves. In this regard, crevice corrosion is most likely to occur under the sample holder and/or around areas masked with lacquer or resin. The presence of crevice attack invalidates the test.
The shape of anodic polarization curves
As a gross oversimplification, the electrochemical response of most anodic cyclic potentiodynamic polarization (CPP) scans can be divided in 3 distinctive cases, as follows.
Case 1: Positive hysteresis and clear signs of pitting corrosion (deep pit condition)
This is the most common case for lower-grade stainless steels (e.g. UNS S30400, UNS S31600, UNS S41000, etc.) and nickel alloys (e.g. UNS N07718 and N08825) in aerated and deaerated seawater, Figure 1.
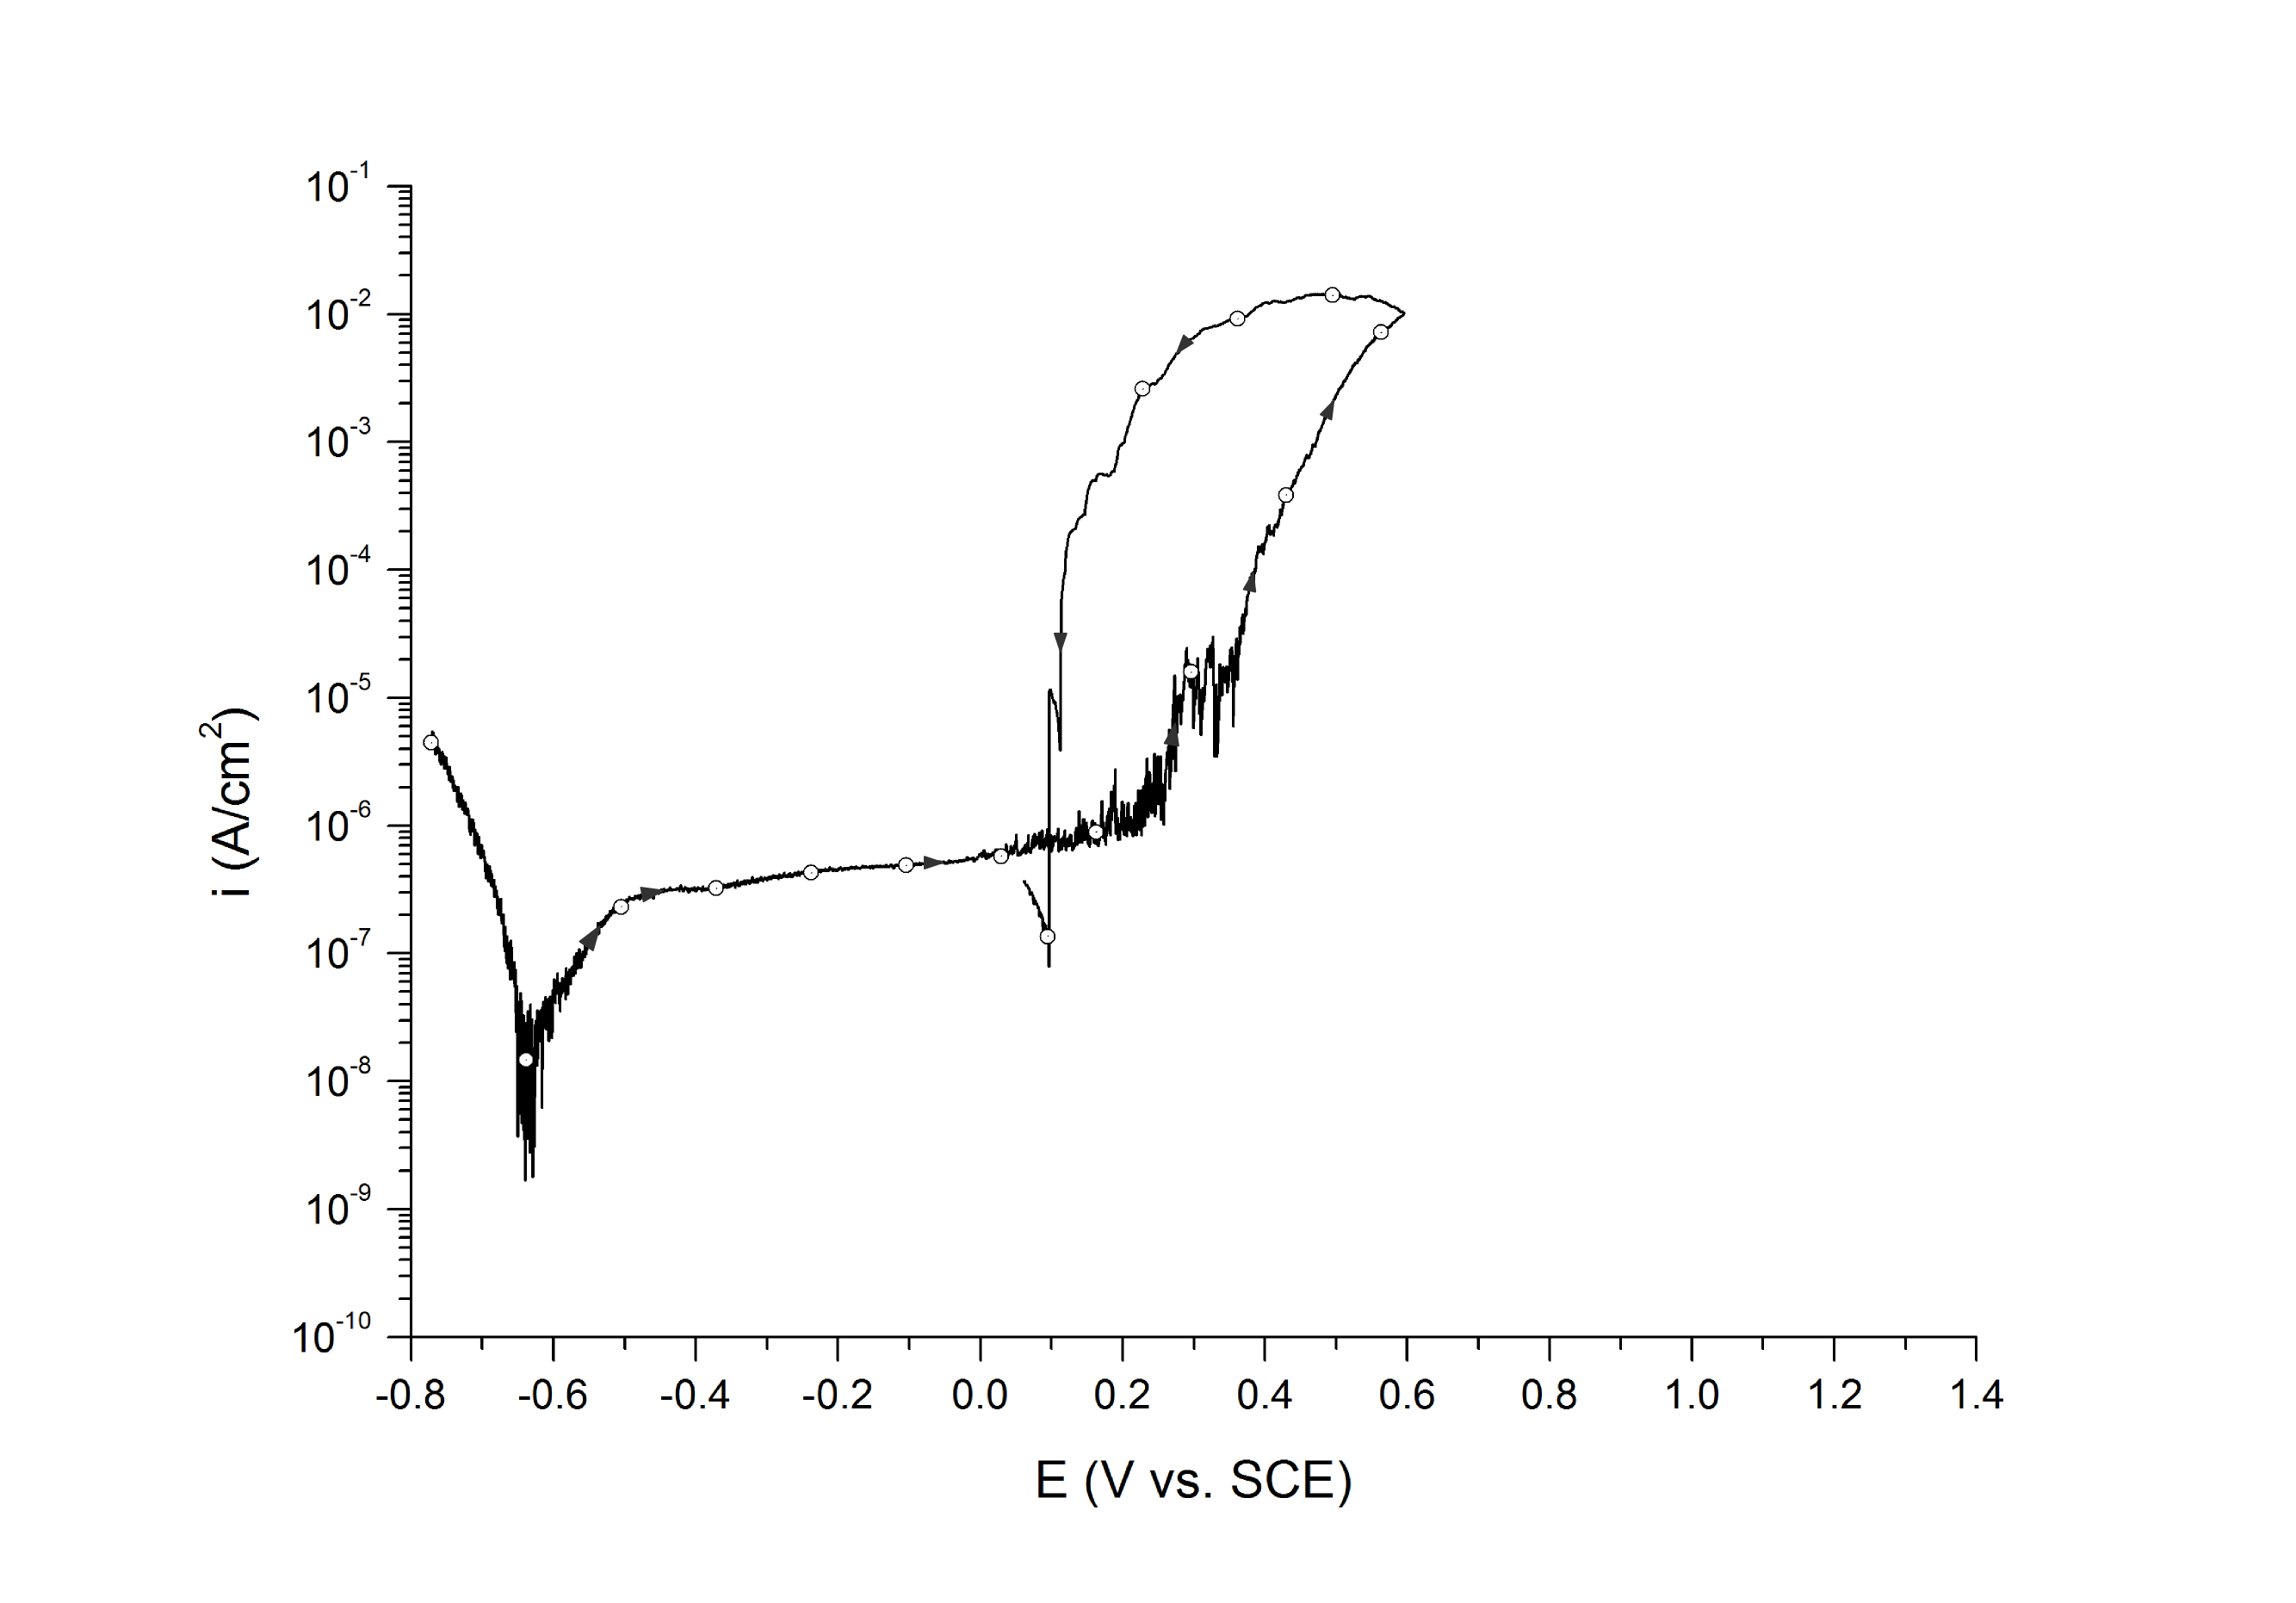
For higher grade corrosion resistant alloys (CRAs) such as type 25Cr super duplex stainless steels (e.g. UNS S32750 and UNS 32760), this response will occur at elevated temperatures above the alloy’s critical pitting temperature (CPT) and/or when deleterious phases (e.g. σ-phase) are present above certain critical volume fraction.
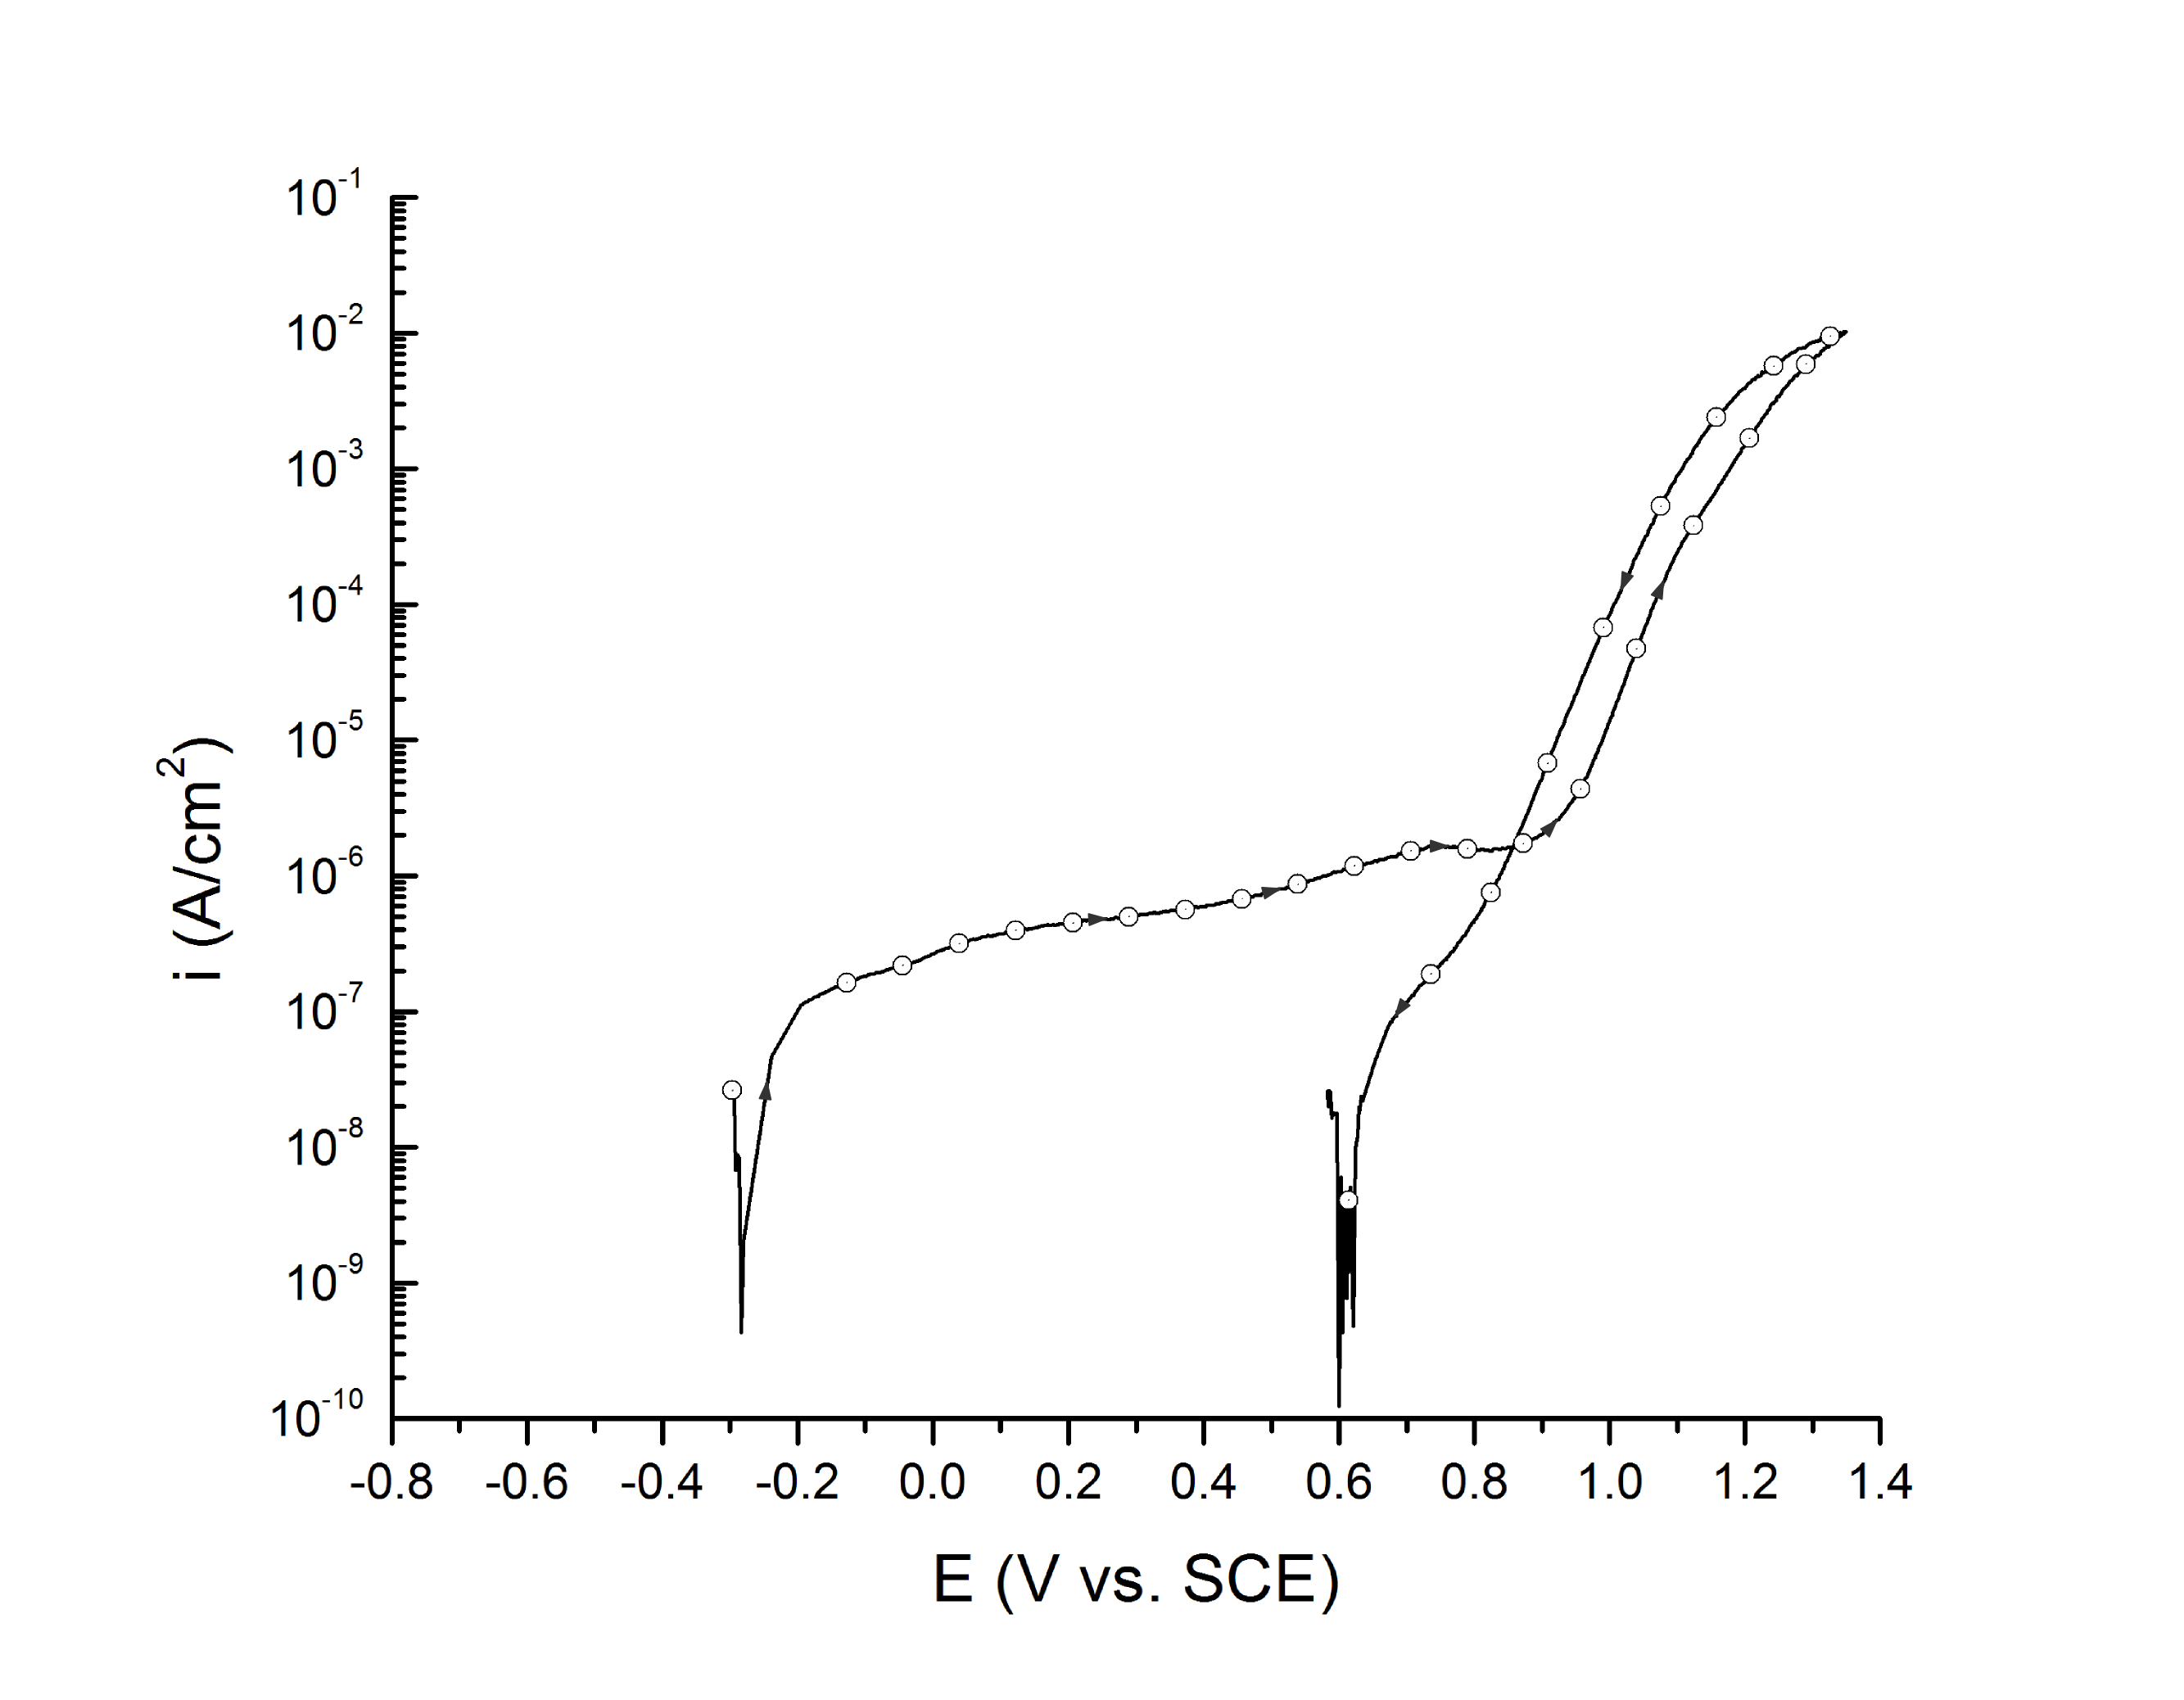
Case 2: Little hysteresis, high breakdown potentials, and small pits
This is the most common case for most duplex and super duplex stainless steels exposed to seawater at room temperature, Figure 2.
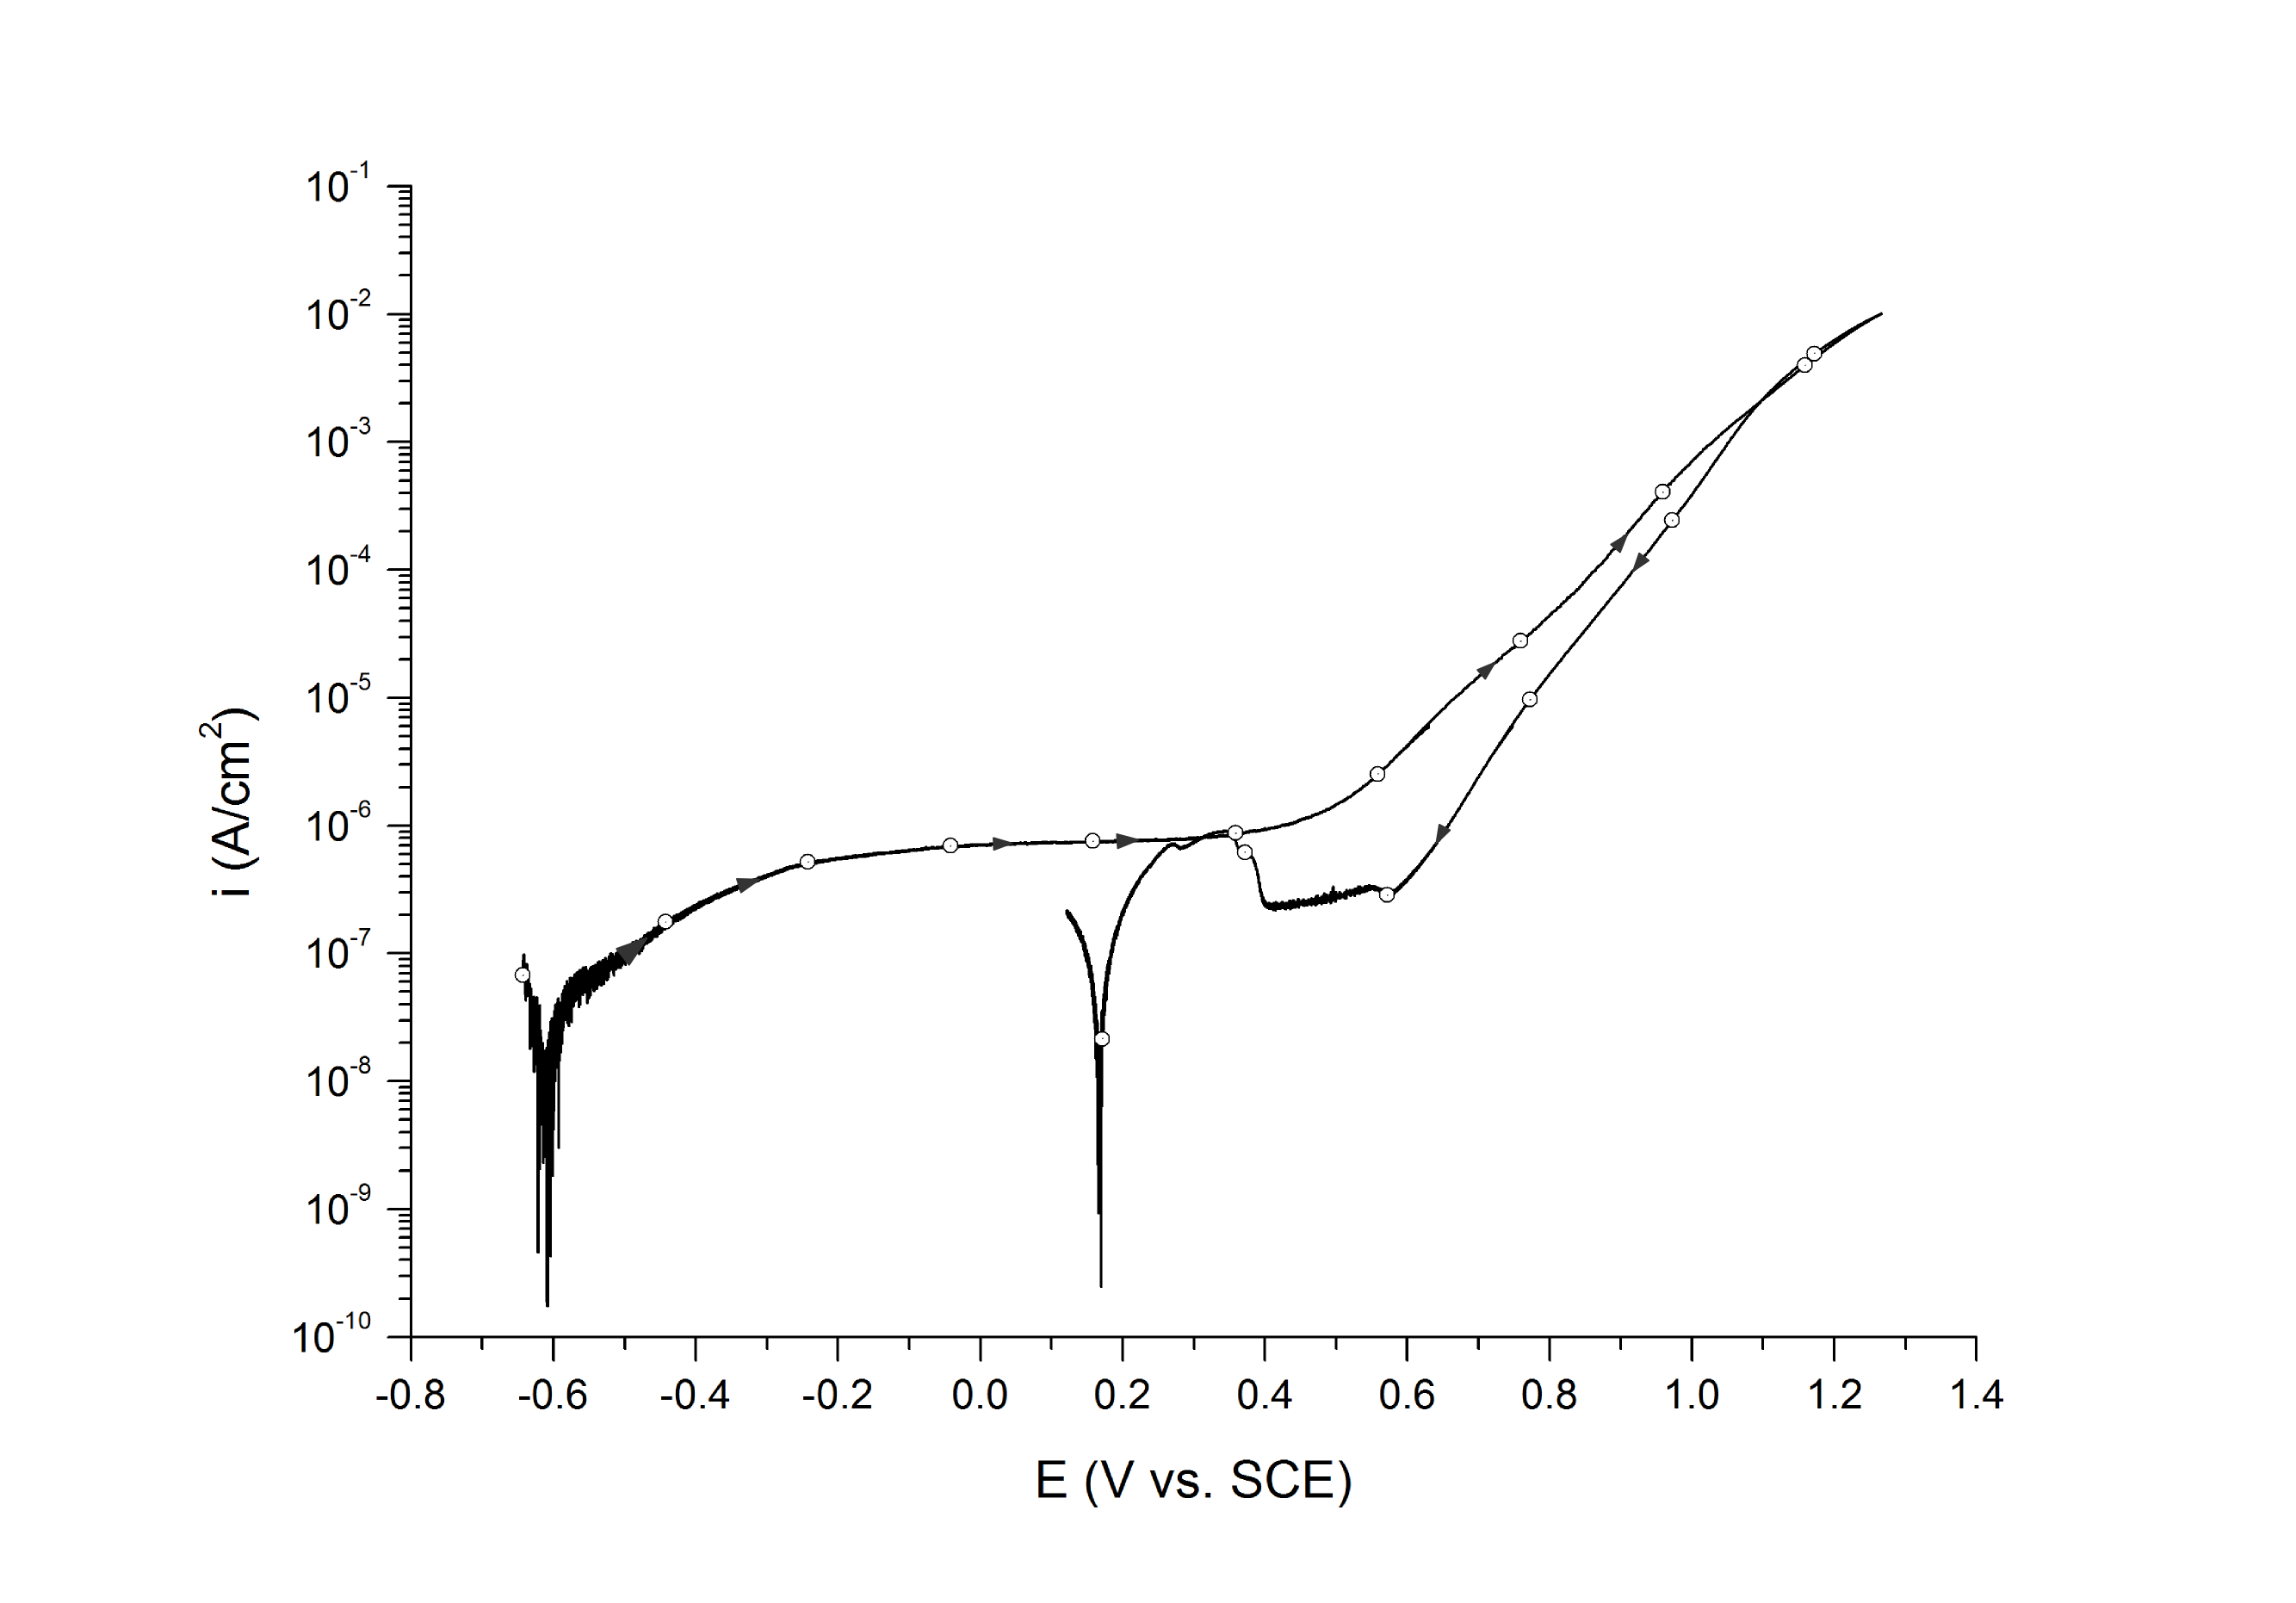
Case 3: No hysteresis, oxygen evolution, and transpassive dissolution
This behavior is common on nickel alloys with pitting resistant equivalent (PRE) values above 40 (e.g. UNS N06625) and super austenitic stainless steels (UNS S31254), Figure 3.
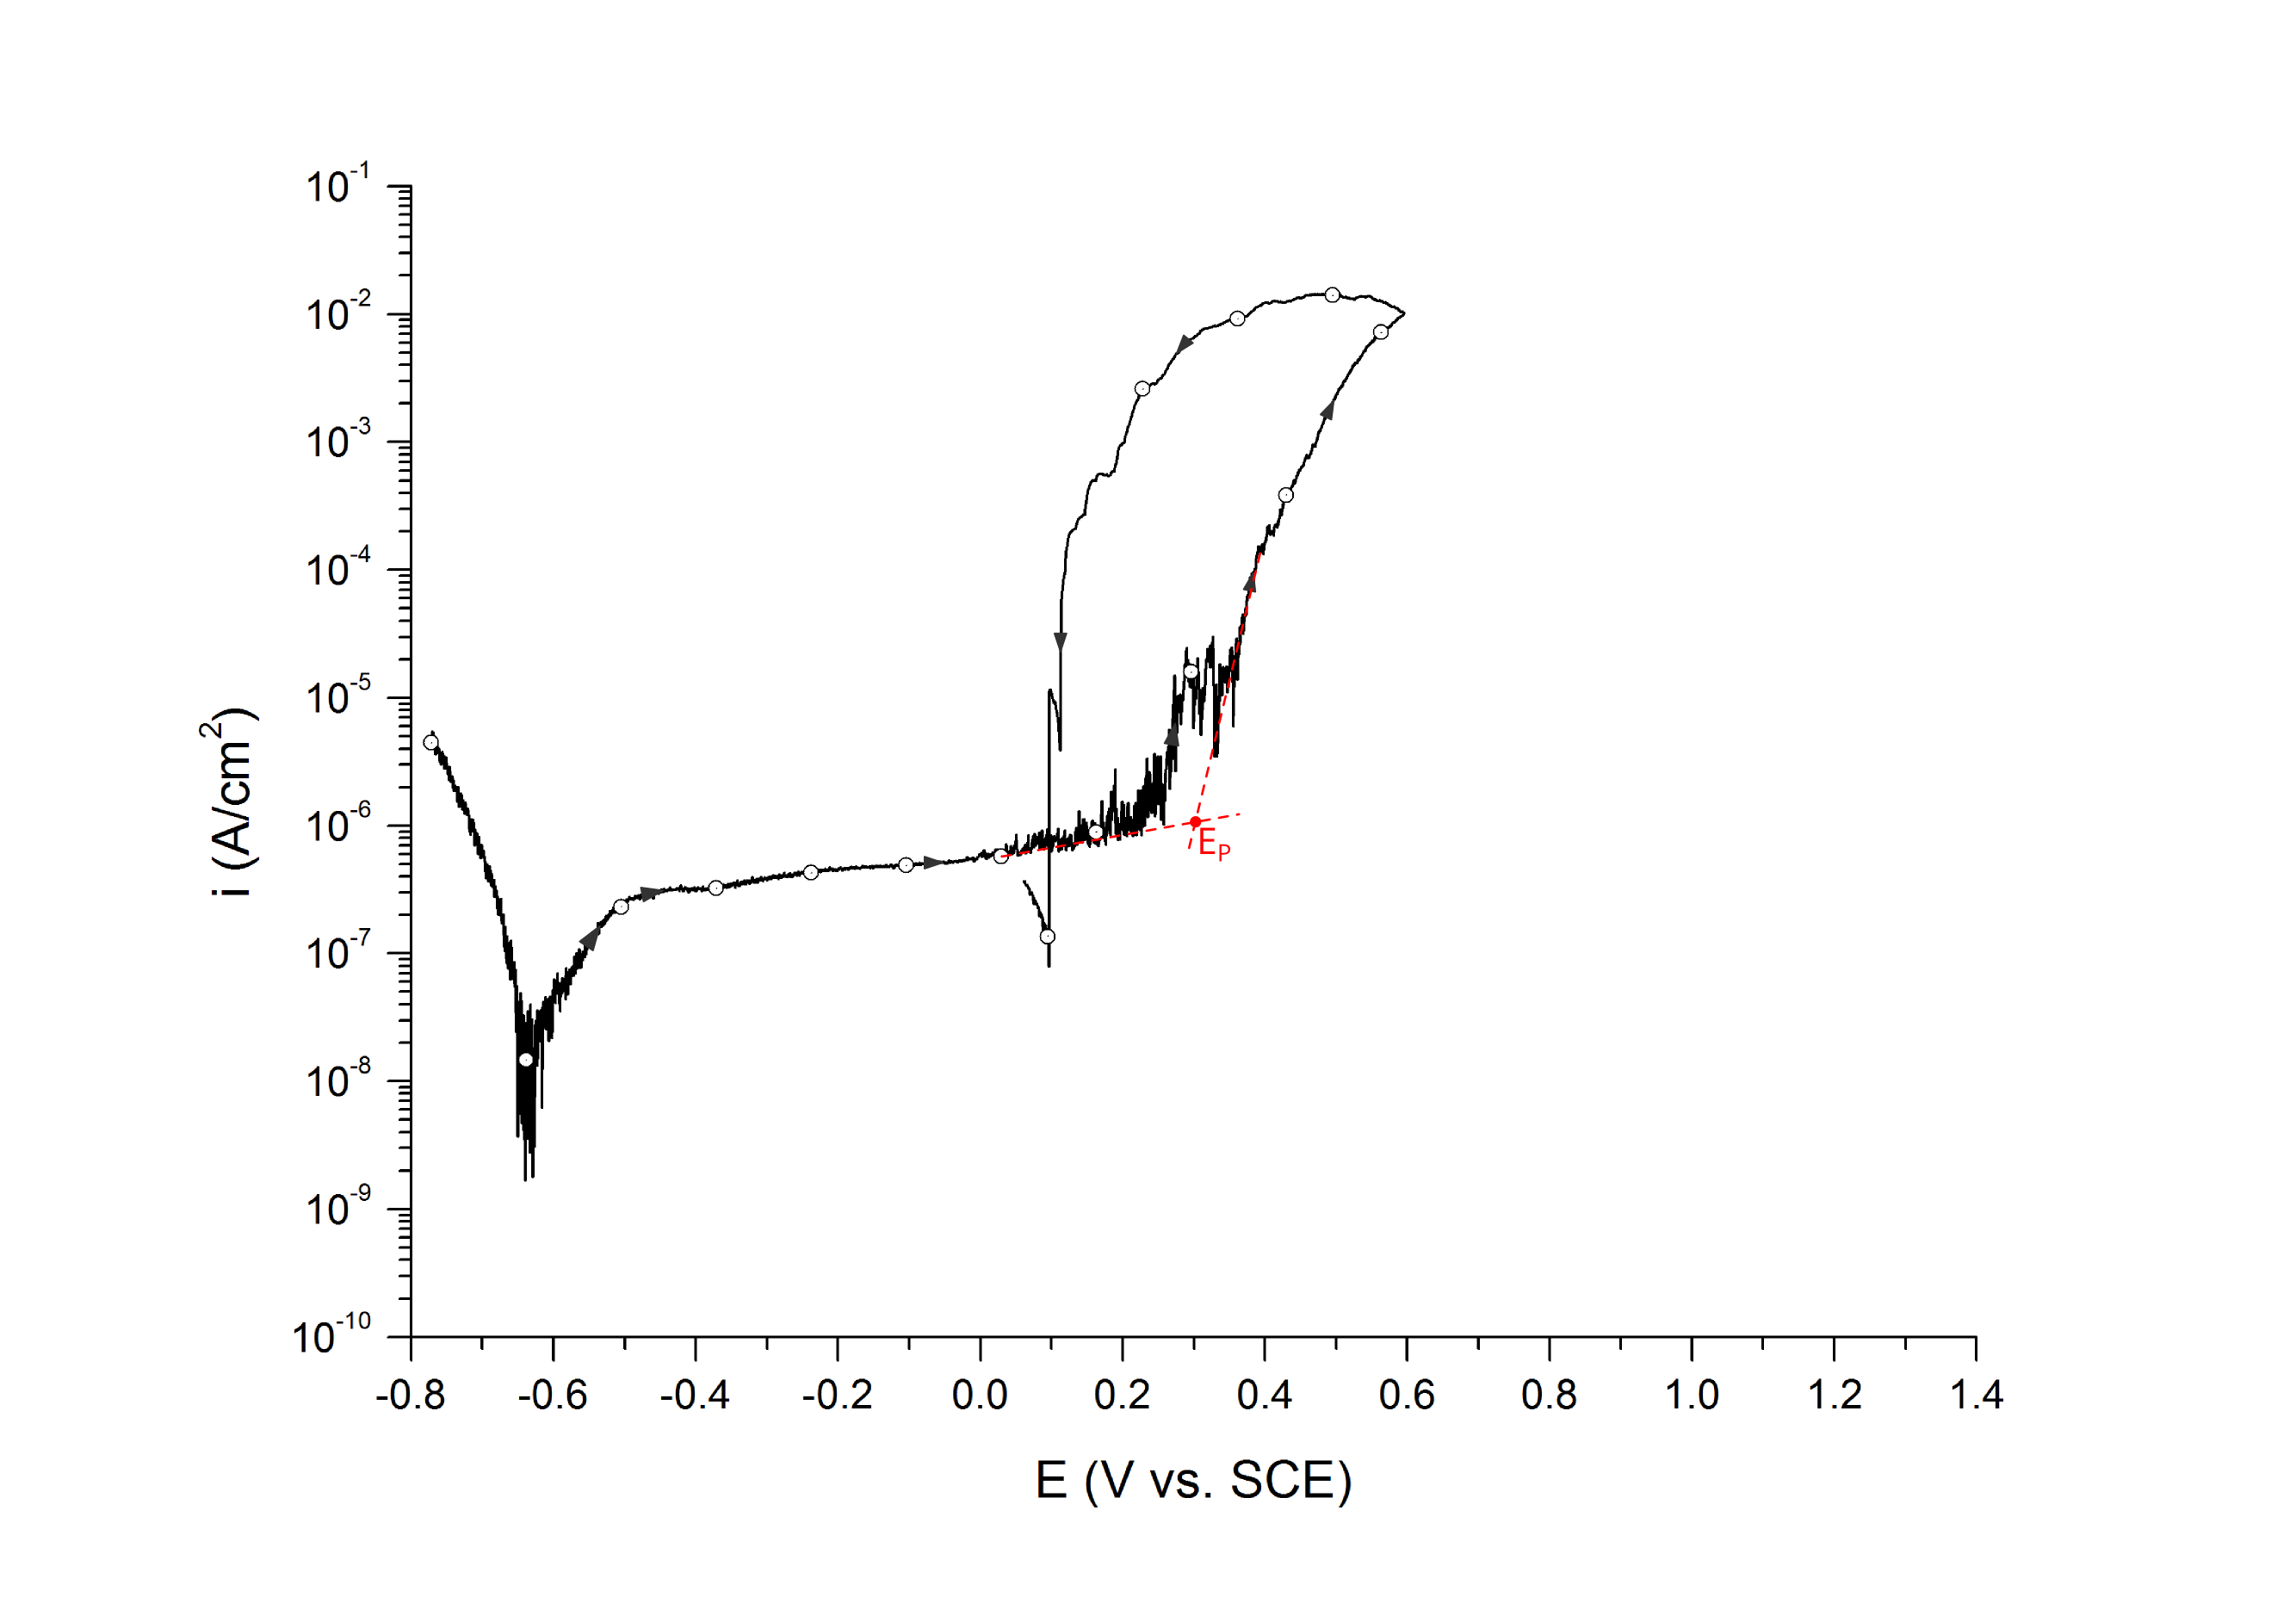
Measuring pitting potentials
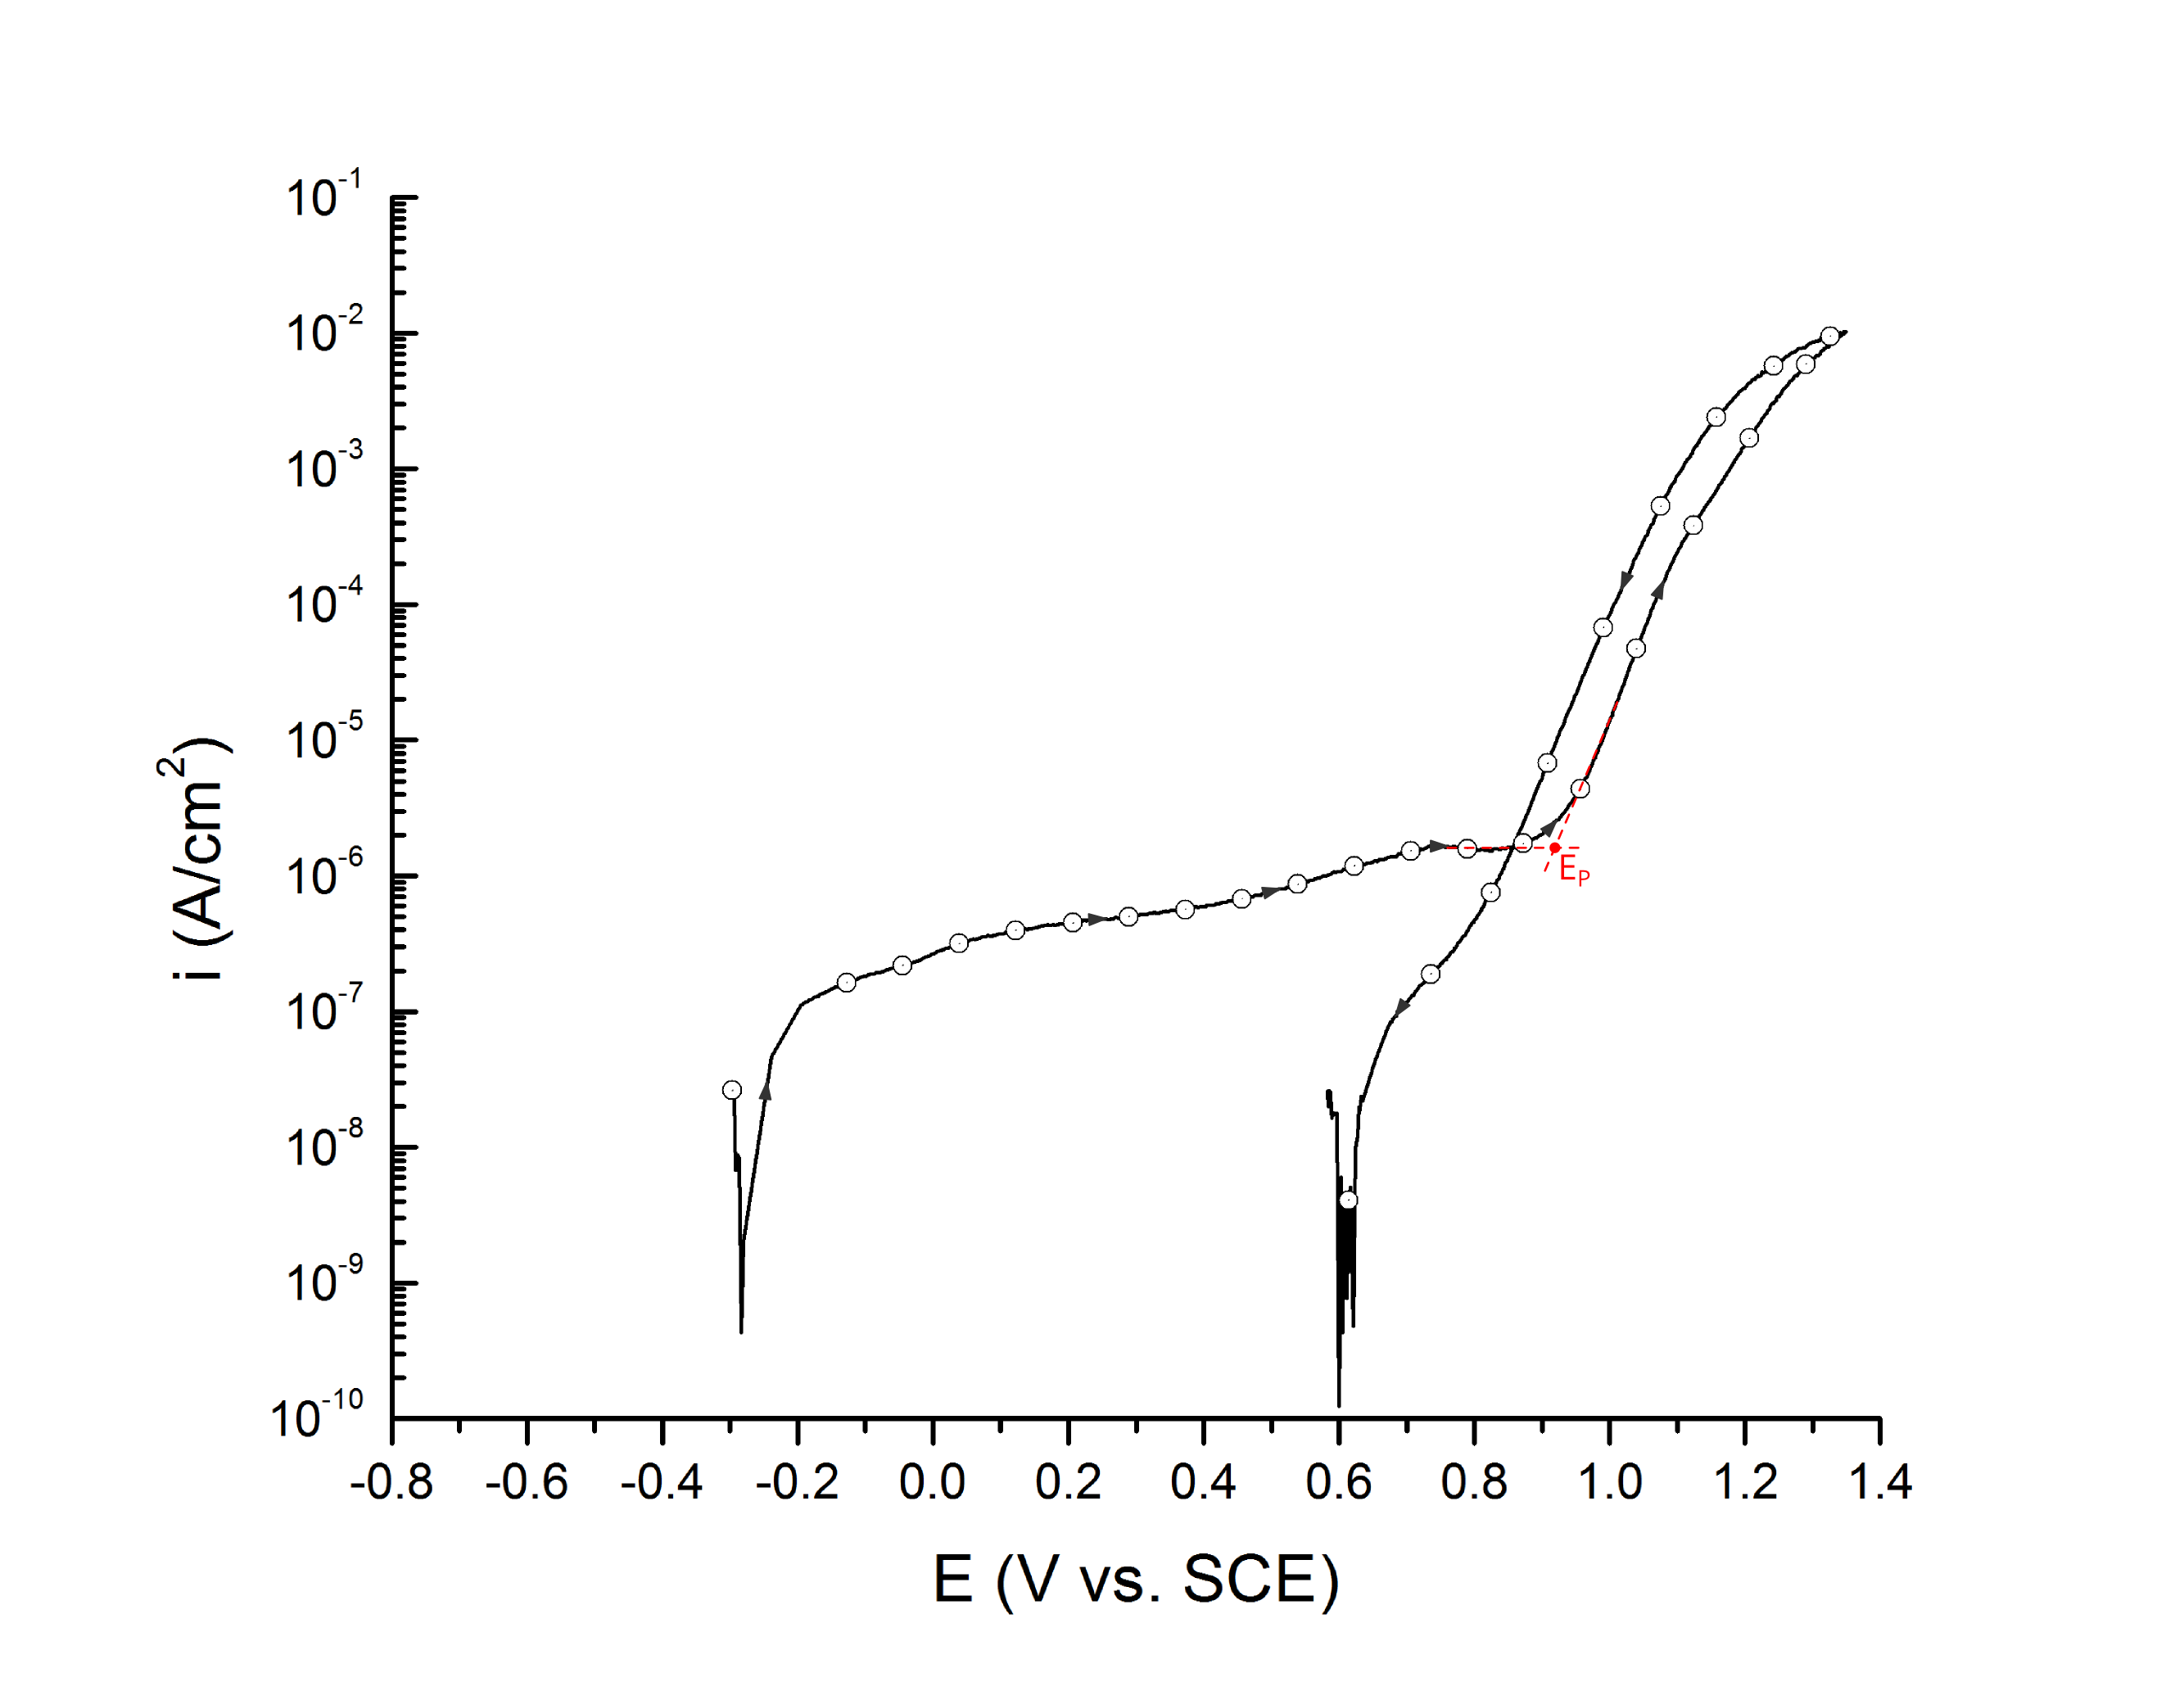
EP can be determined at the inflection point 1,2 or at an arbitrary current density 3 value above the sharp change in slope.
Example 1: UNS S31603 in deaerated seawater at room temperature
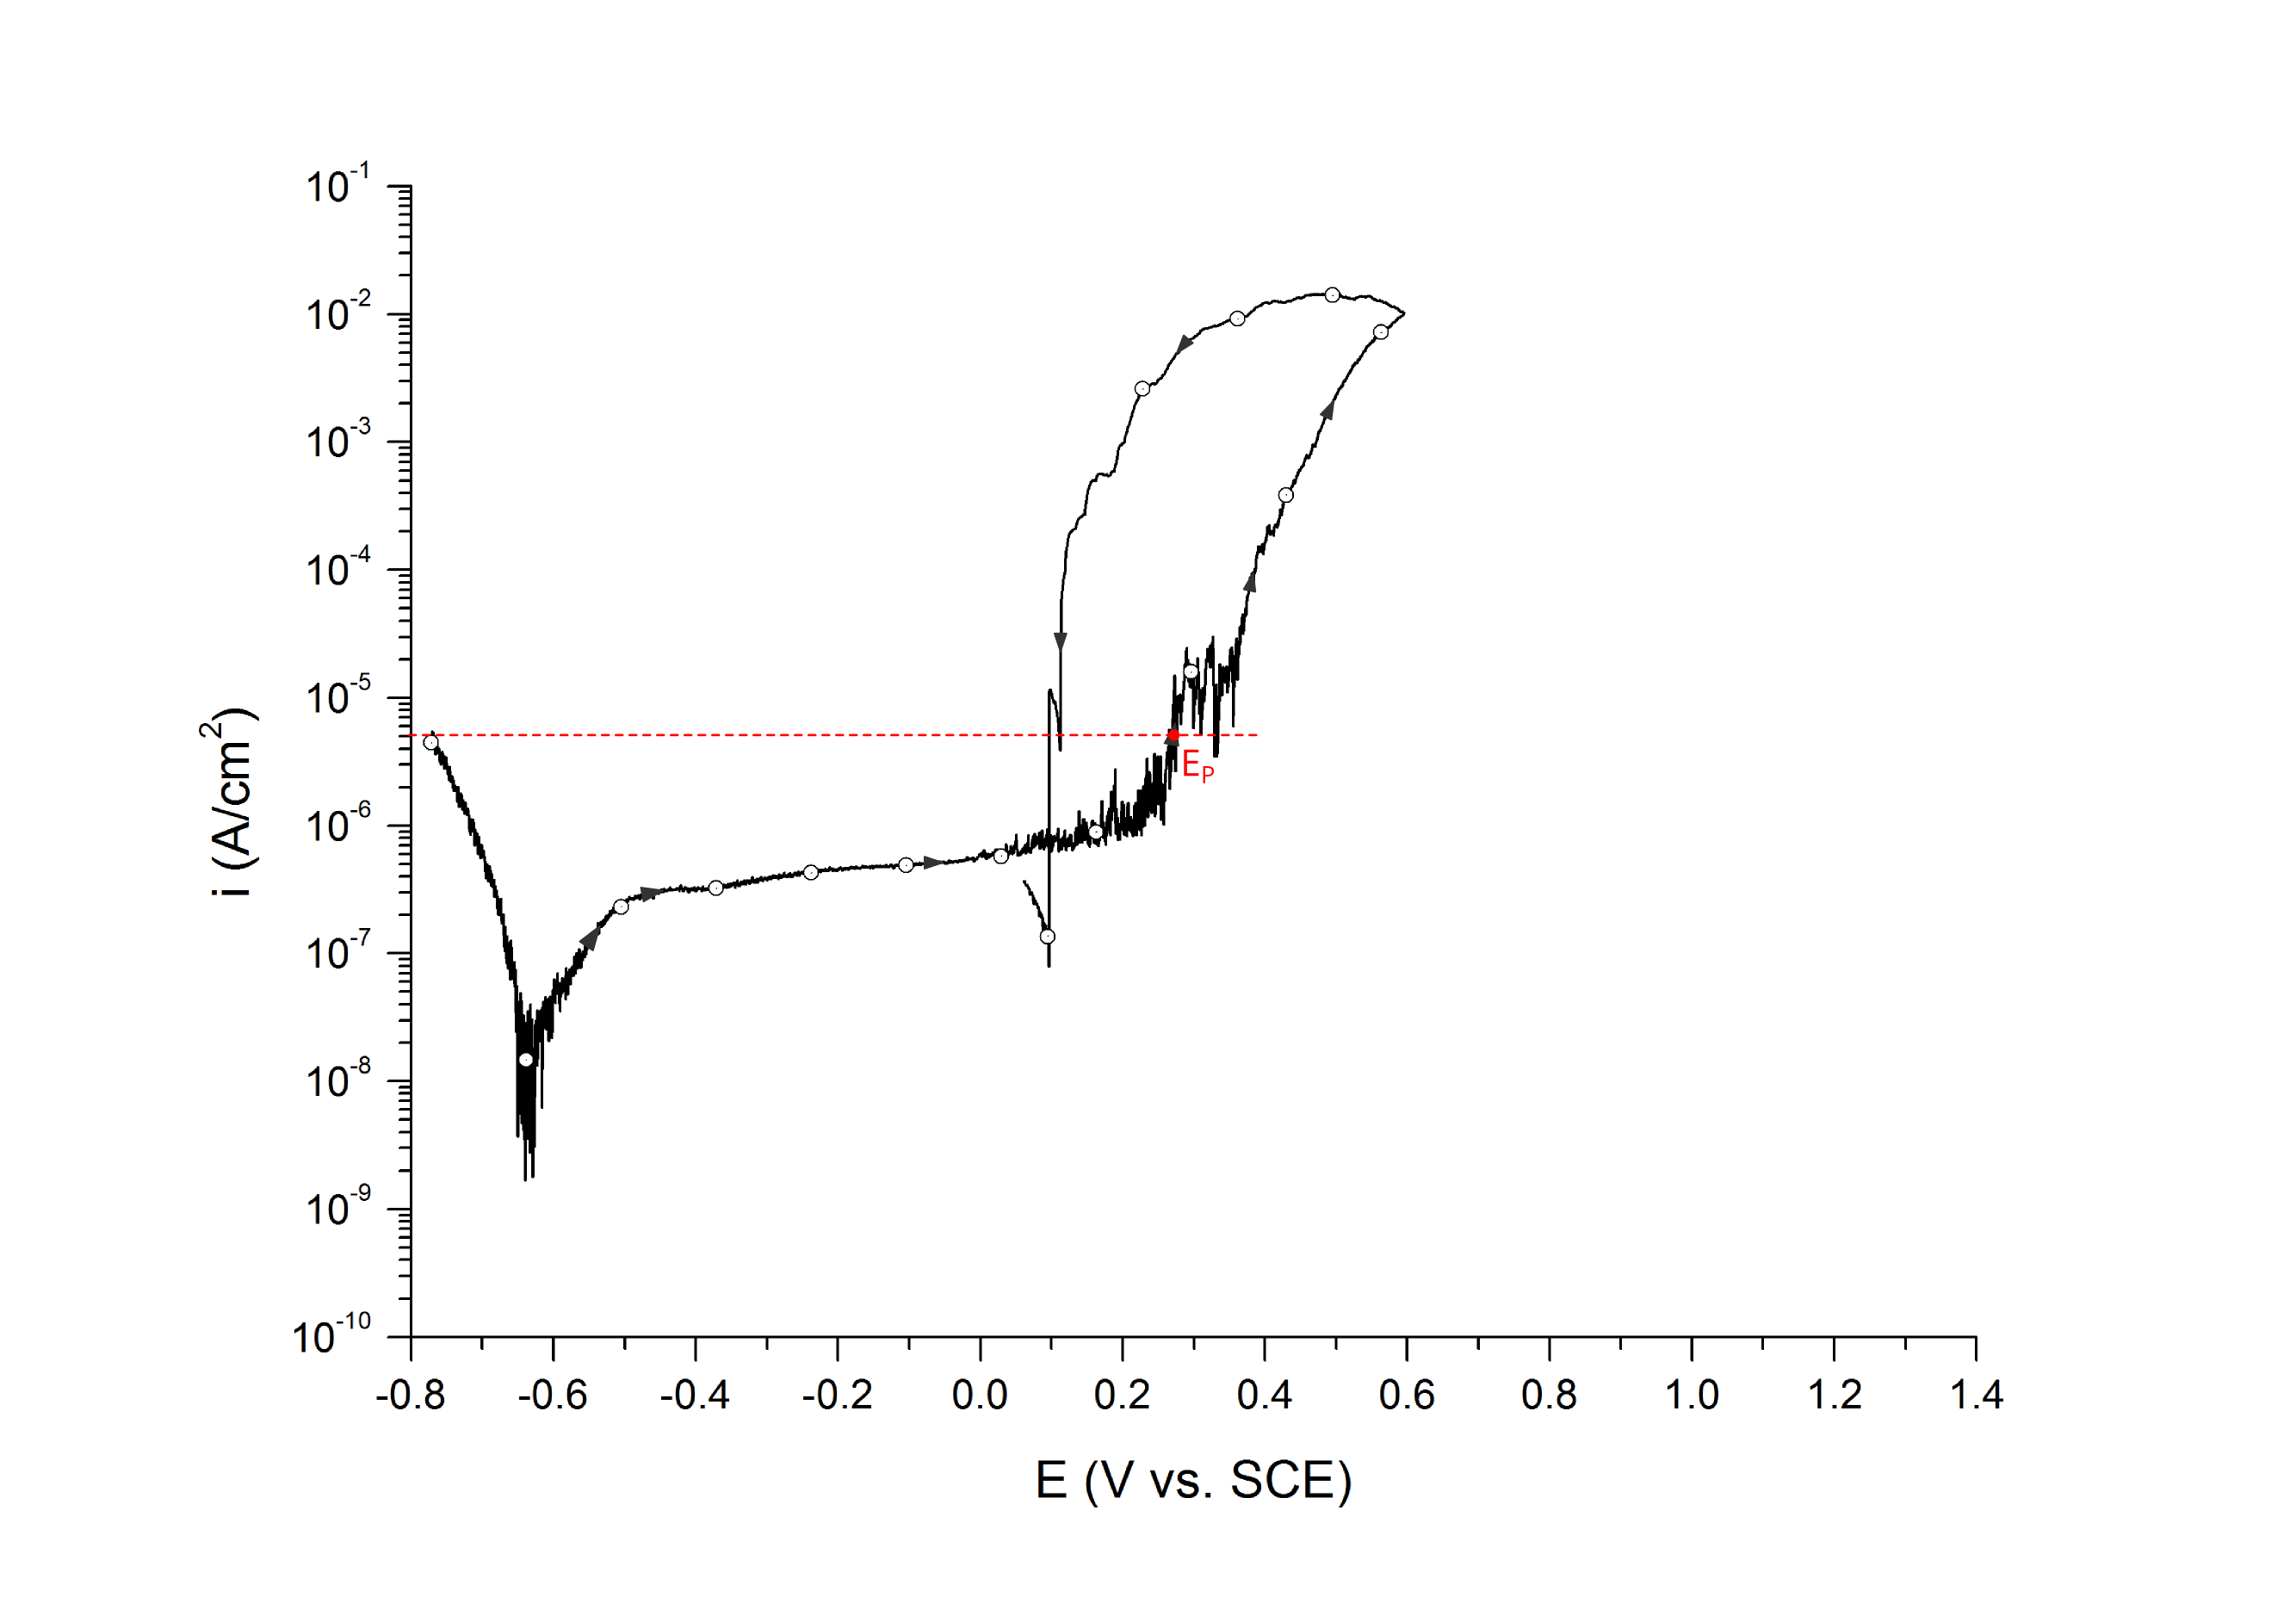
Example 2: UNS S32750 in deaerated seawater at room temperature
Salinas-Bravo and Newman 3, 4 suggested that pitting corrosion, as determined by zero resistance amperometry (ZRA), becomes stable above 5 μA/cm2. Thus, pitting potentials can also be determined as the potential, in the forward scan, at which the current density reaches 5 μA/cm2, Figure 6. Scully et al. 4 have also defined EP as the potential at which the rising current permanently exceeded 10 μA. However, given that the authors did not provide the dimensions of the exposed portion of the either 250 μm commercial stainless steel wires or the 6.35 mm research-grade rods used for their investigation, no general current density threshold can be inferred from their research.
Measuring repassivation potentials
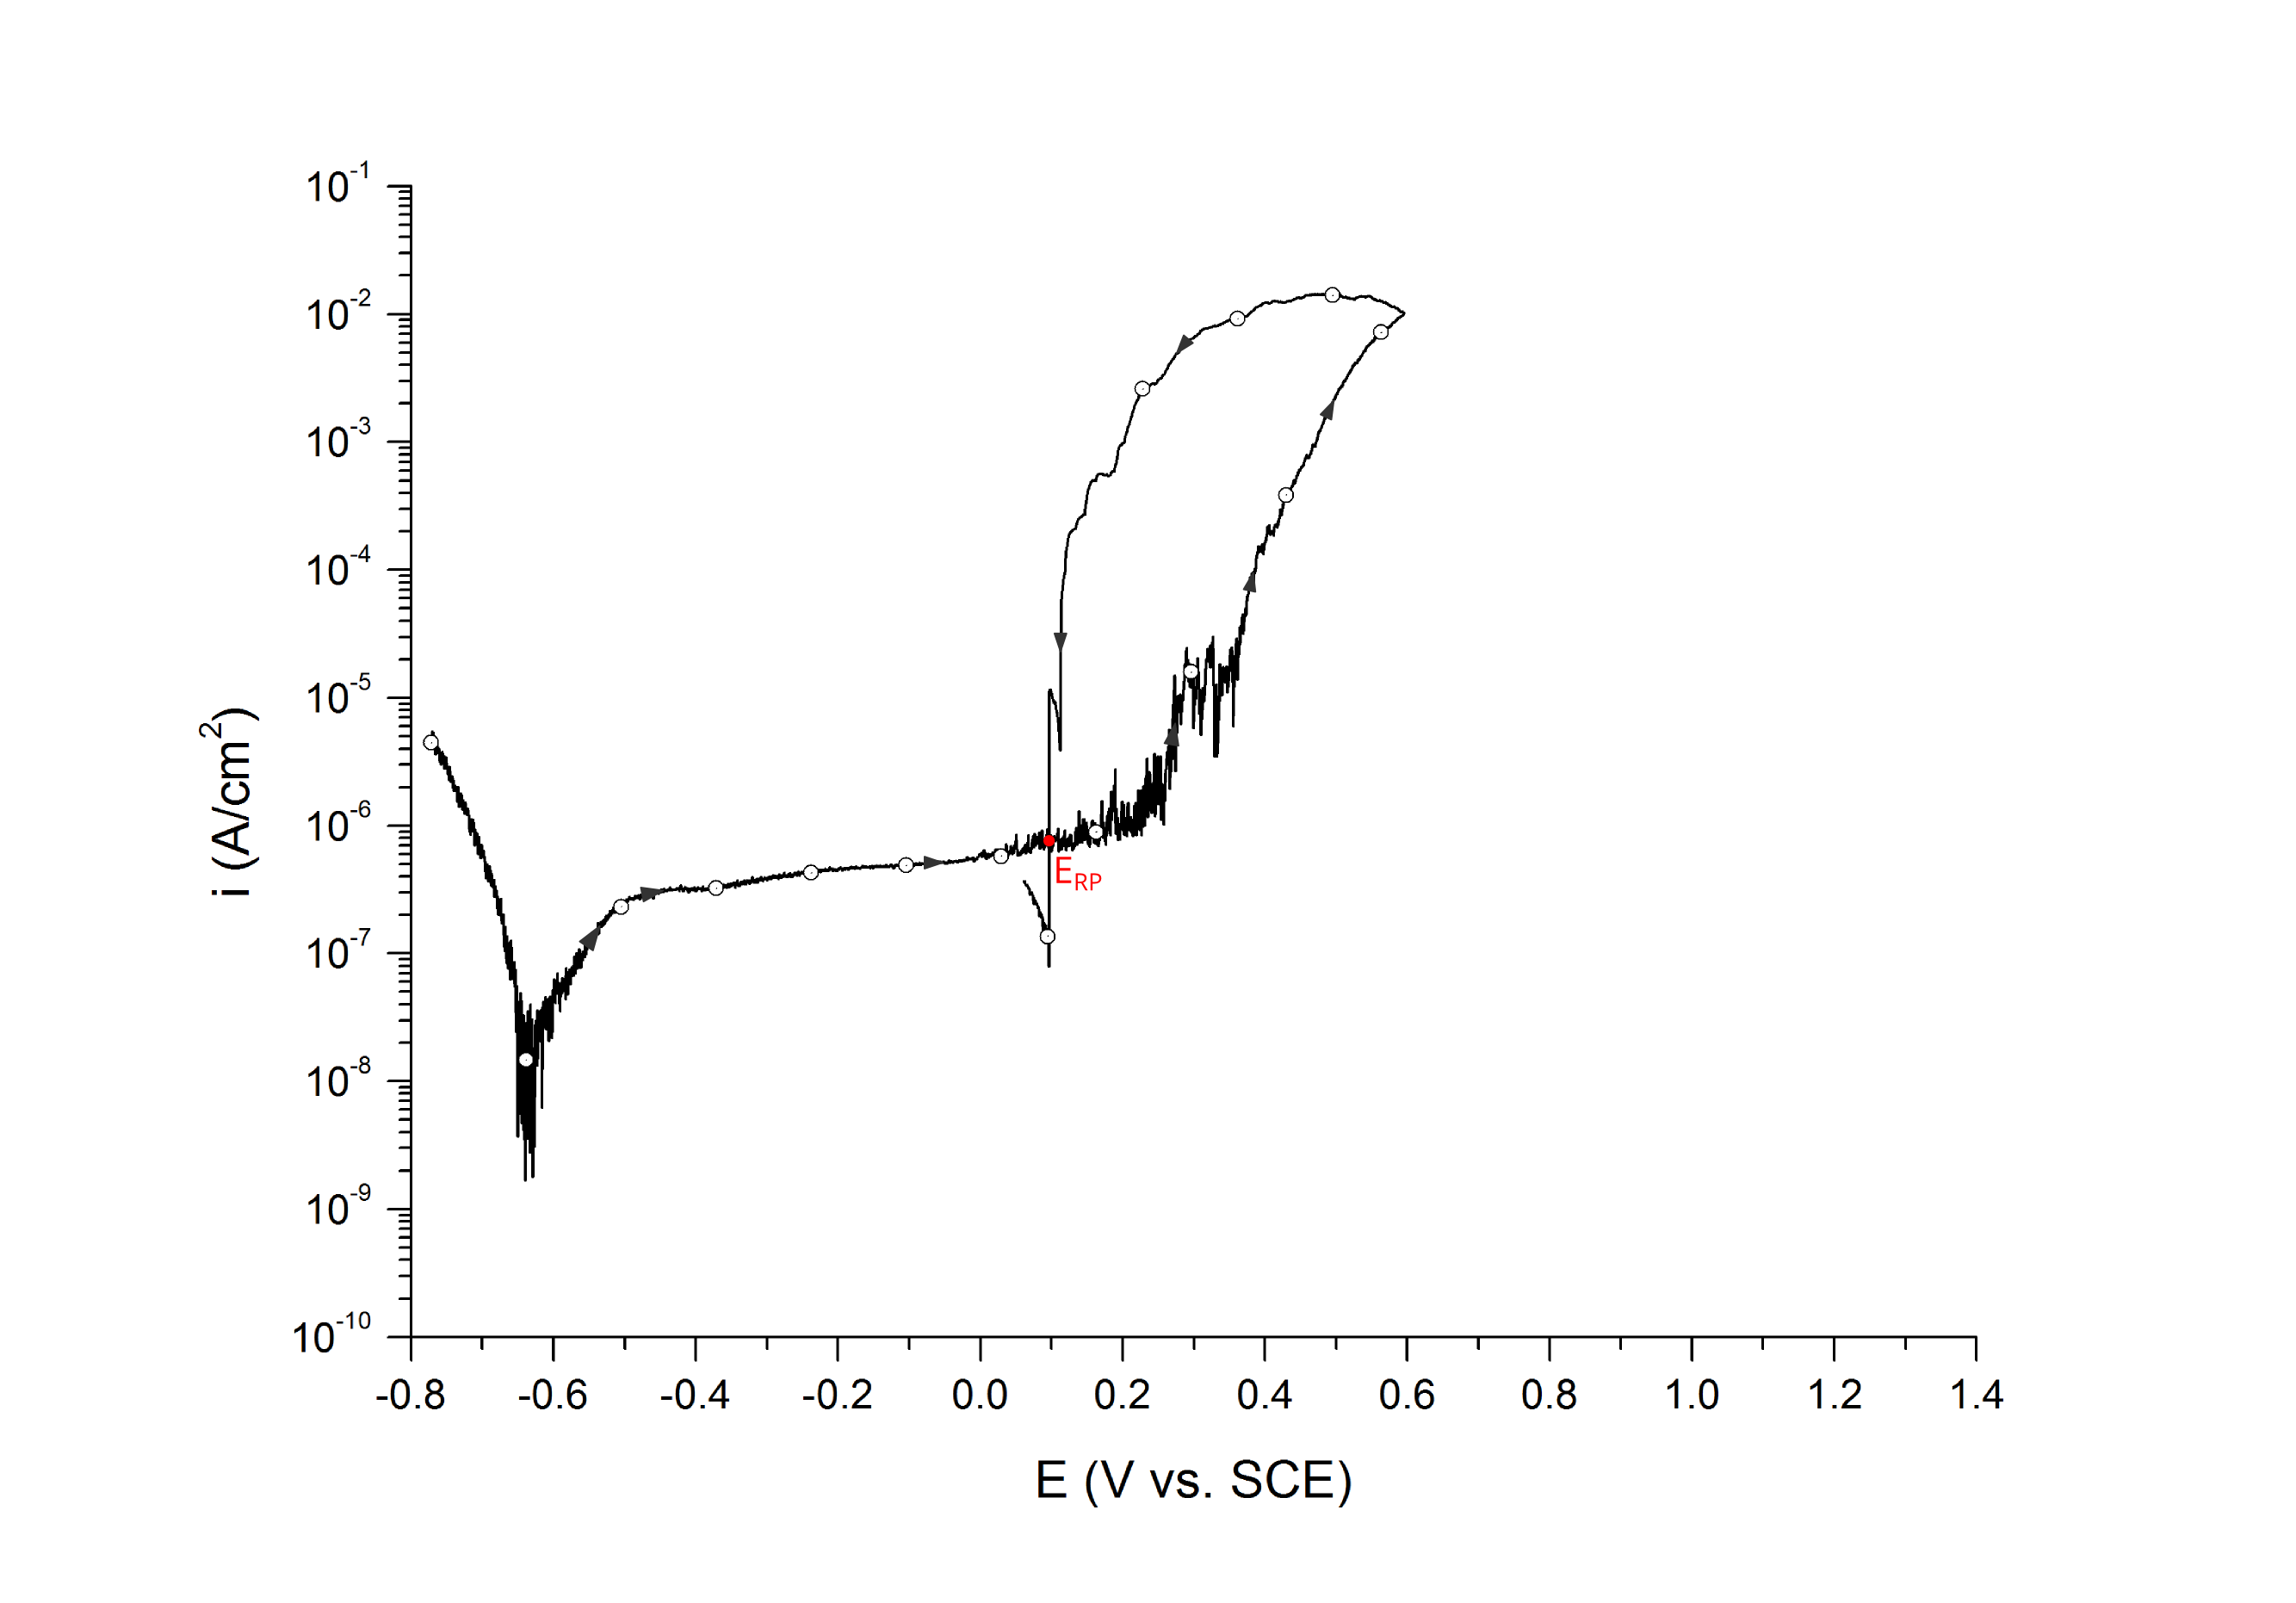
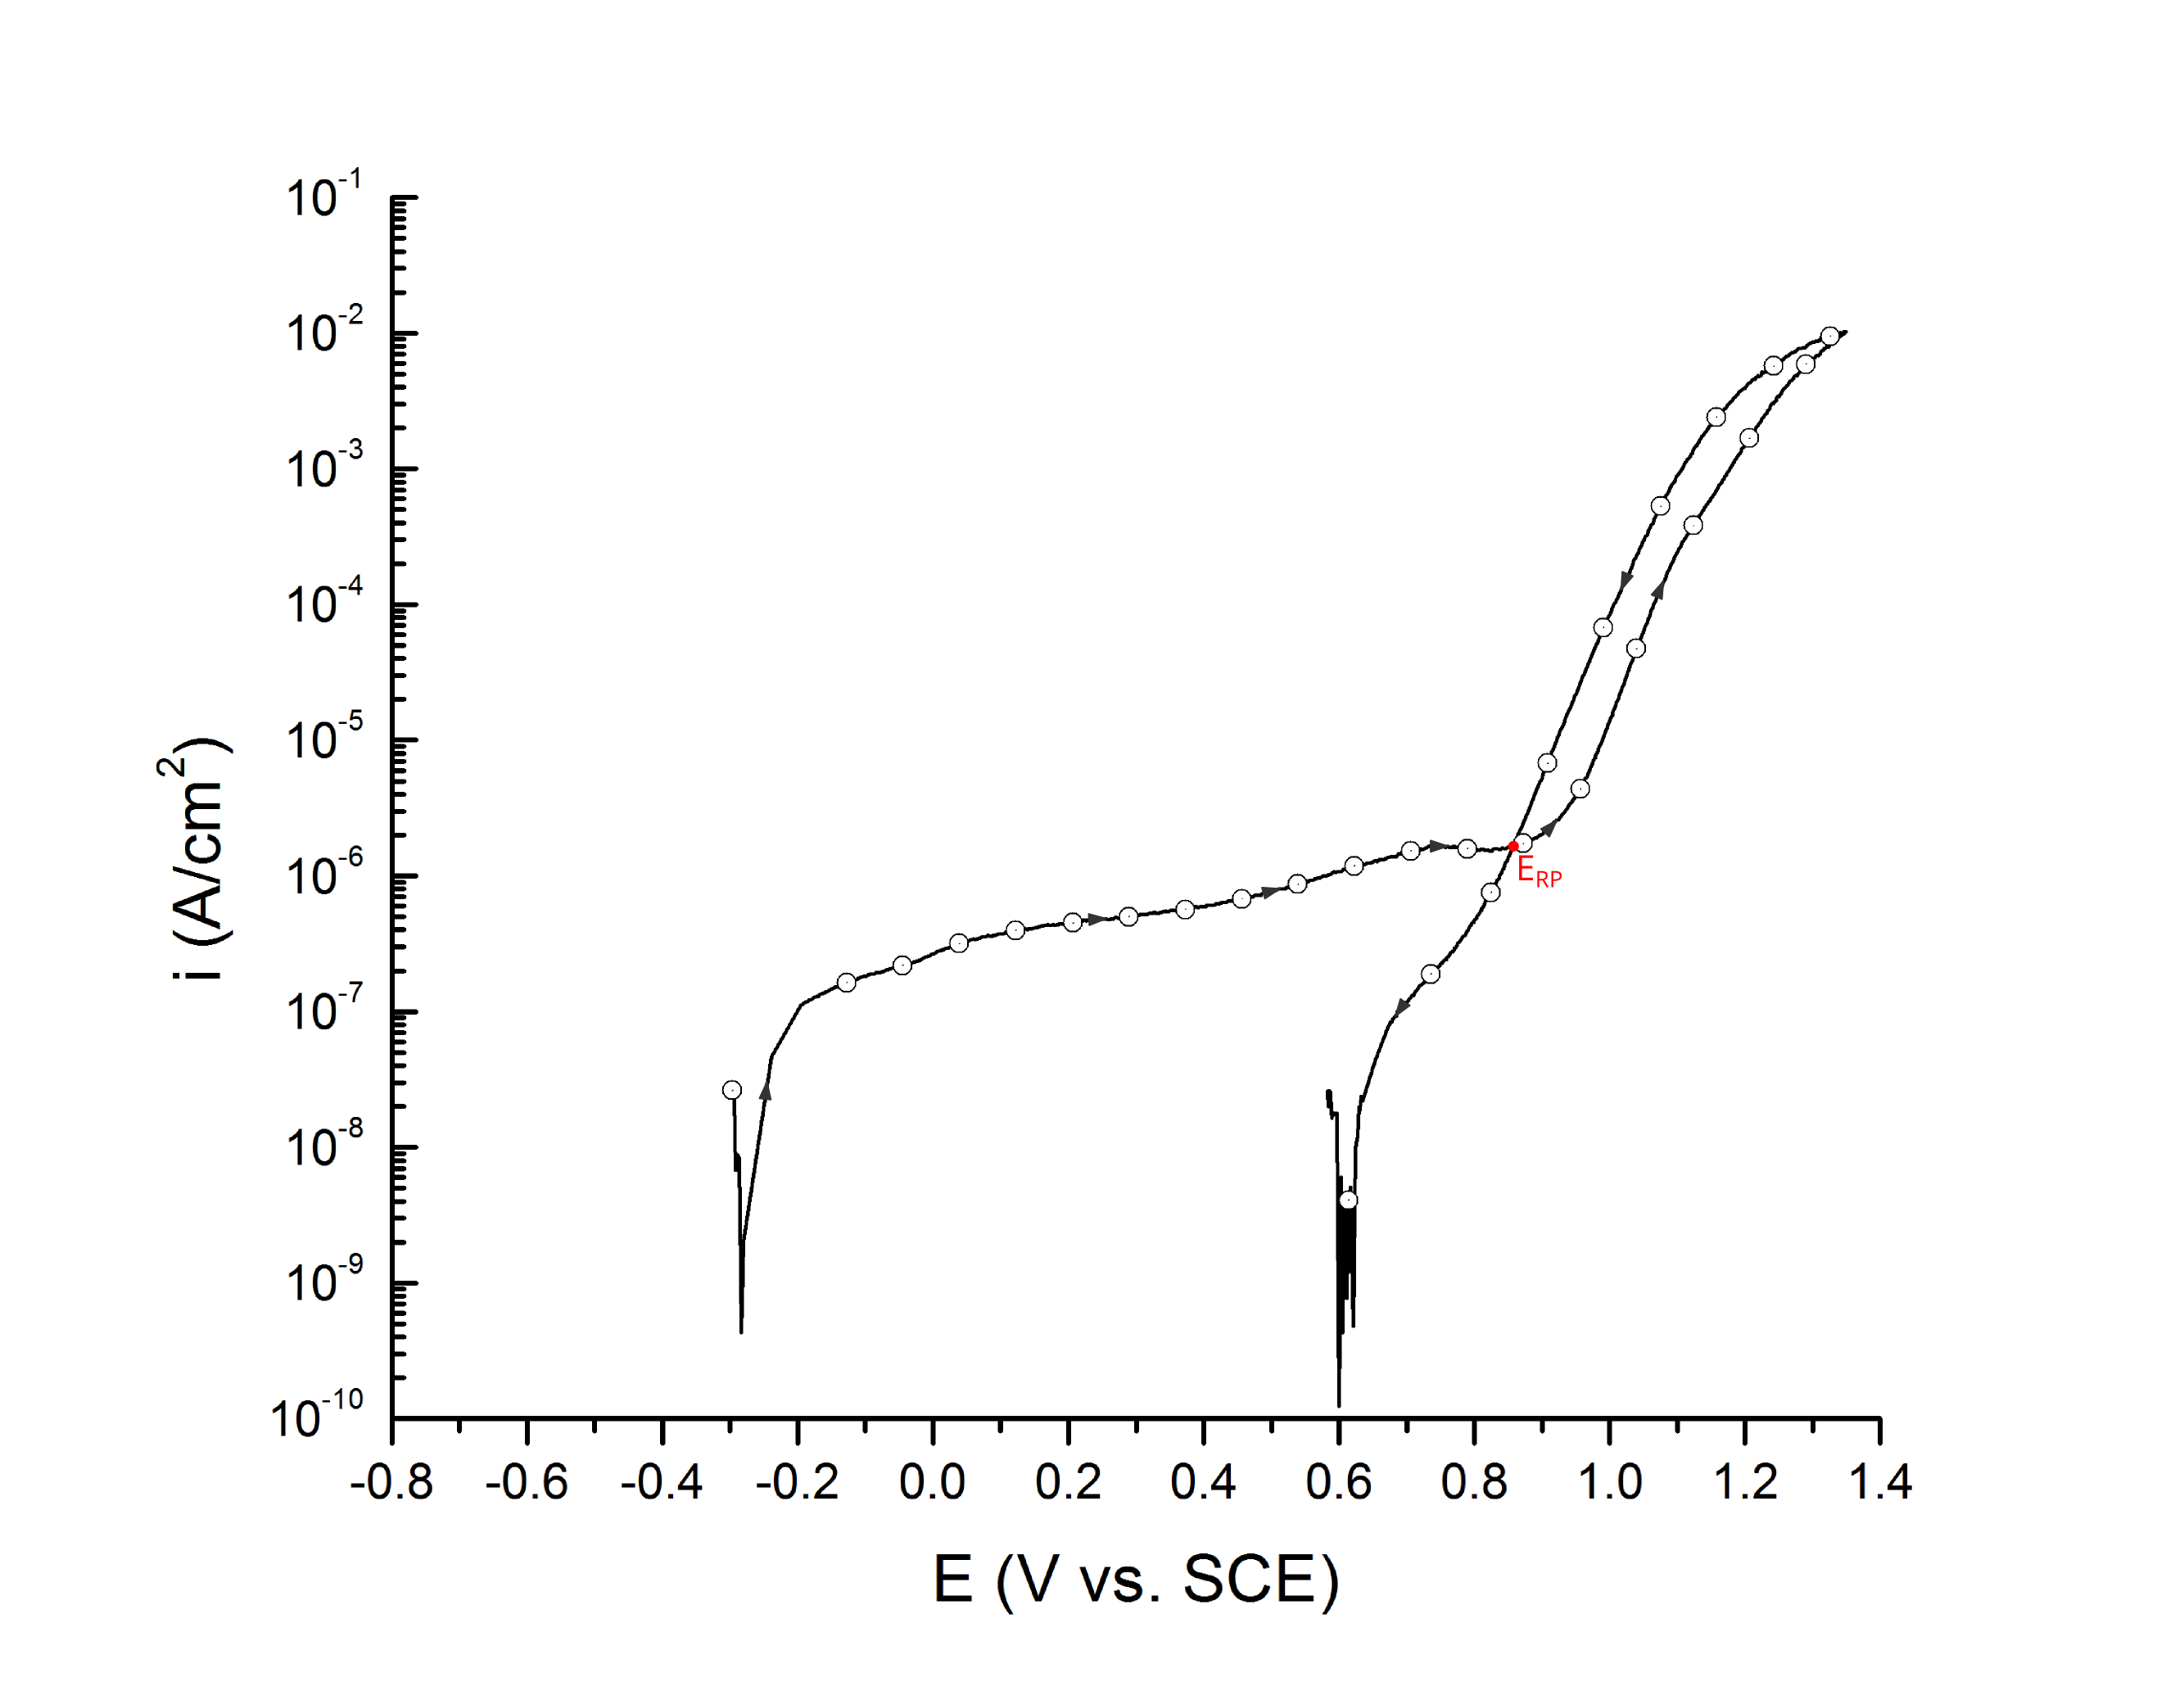
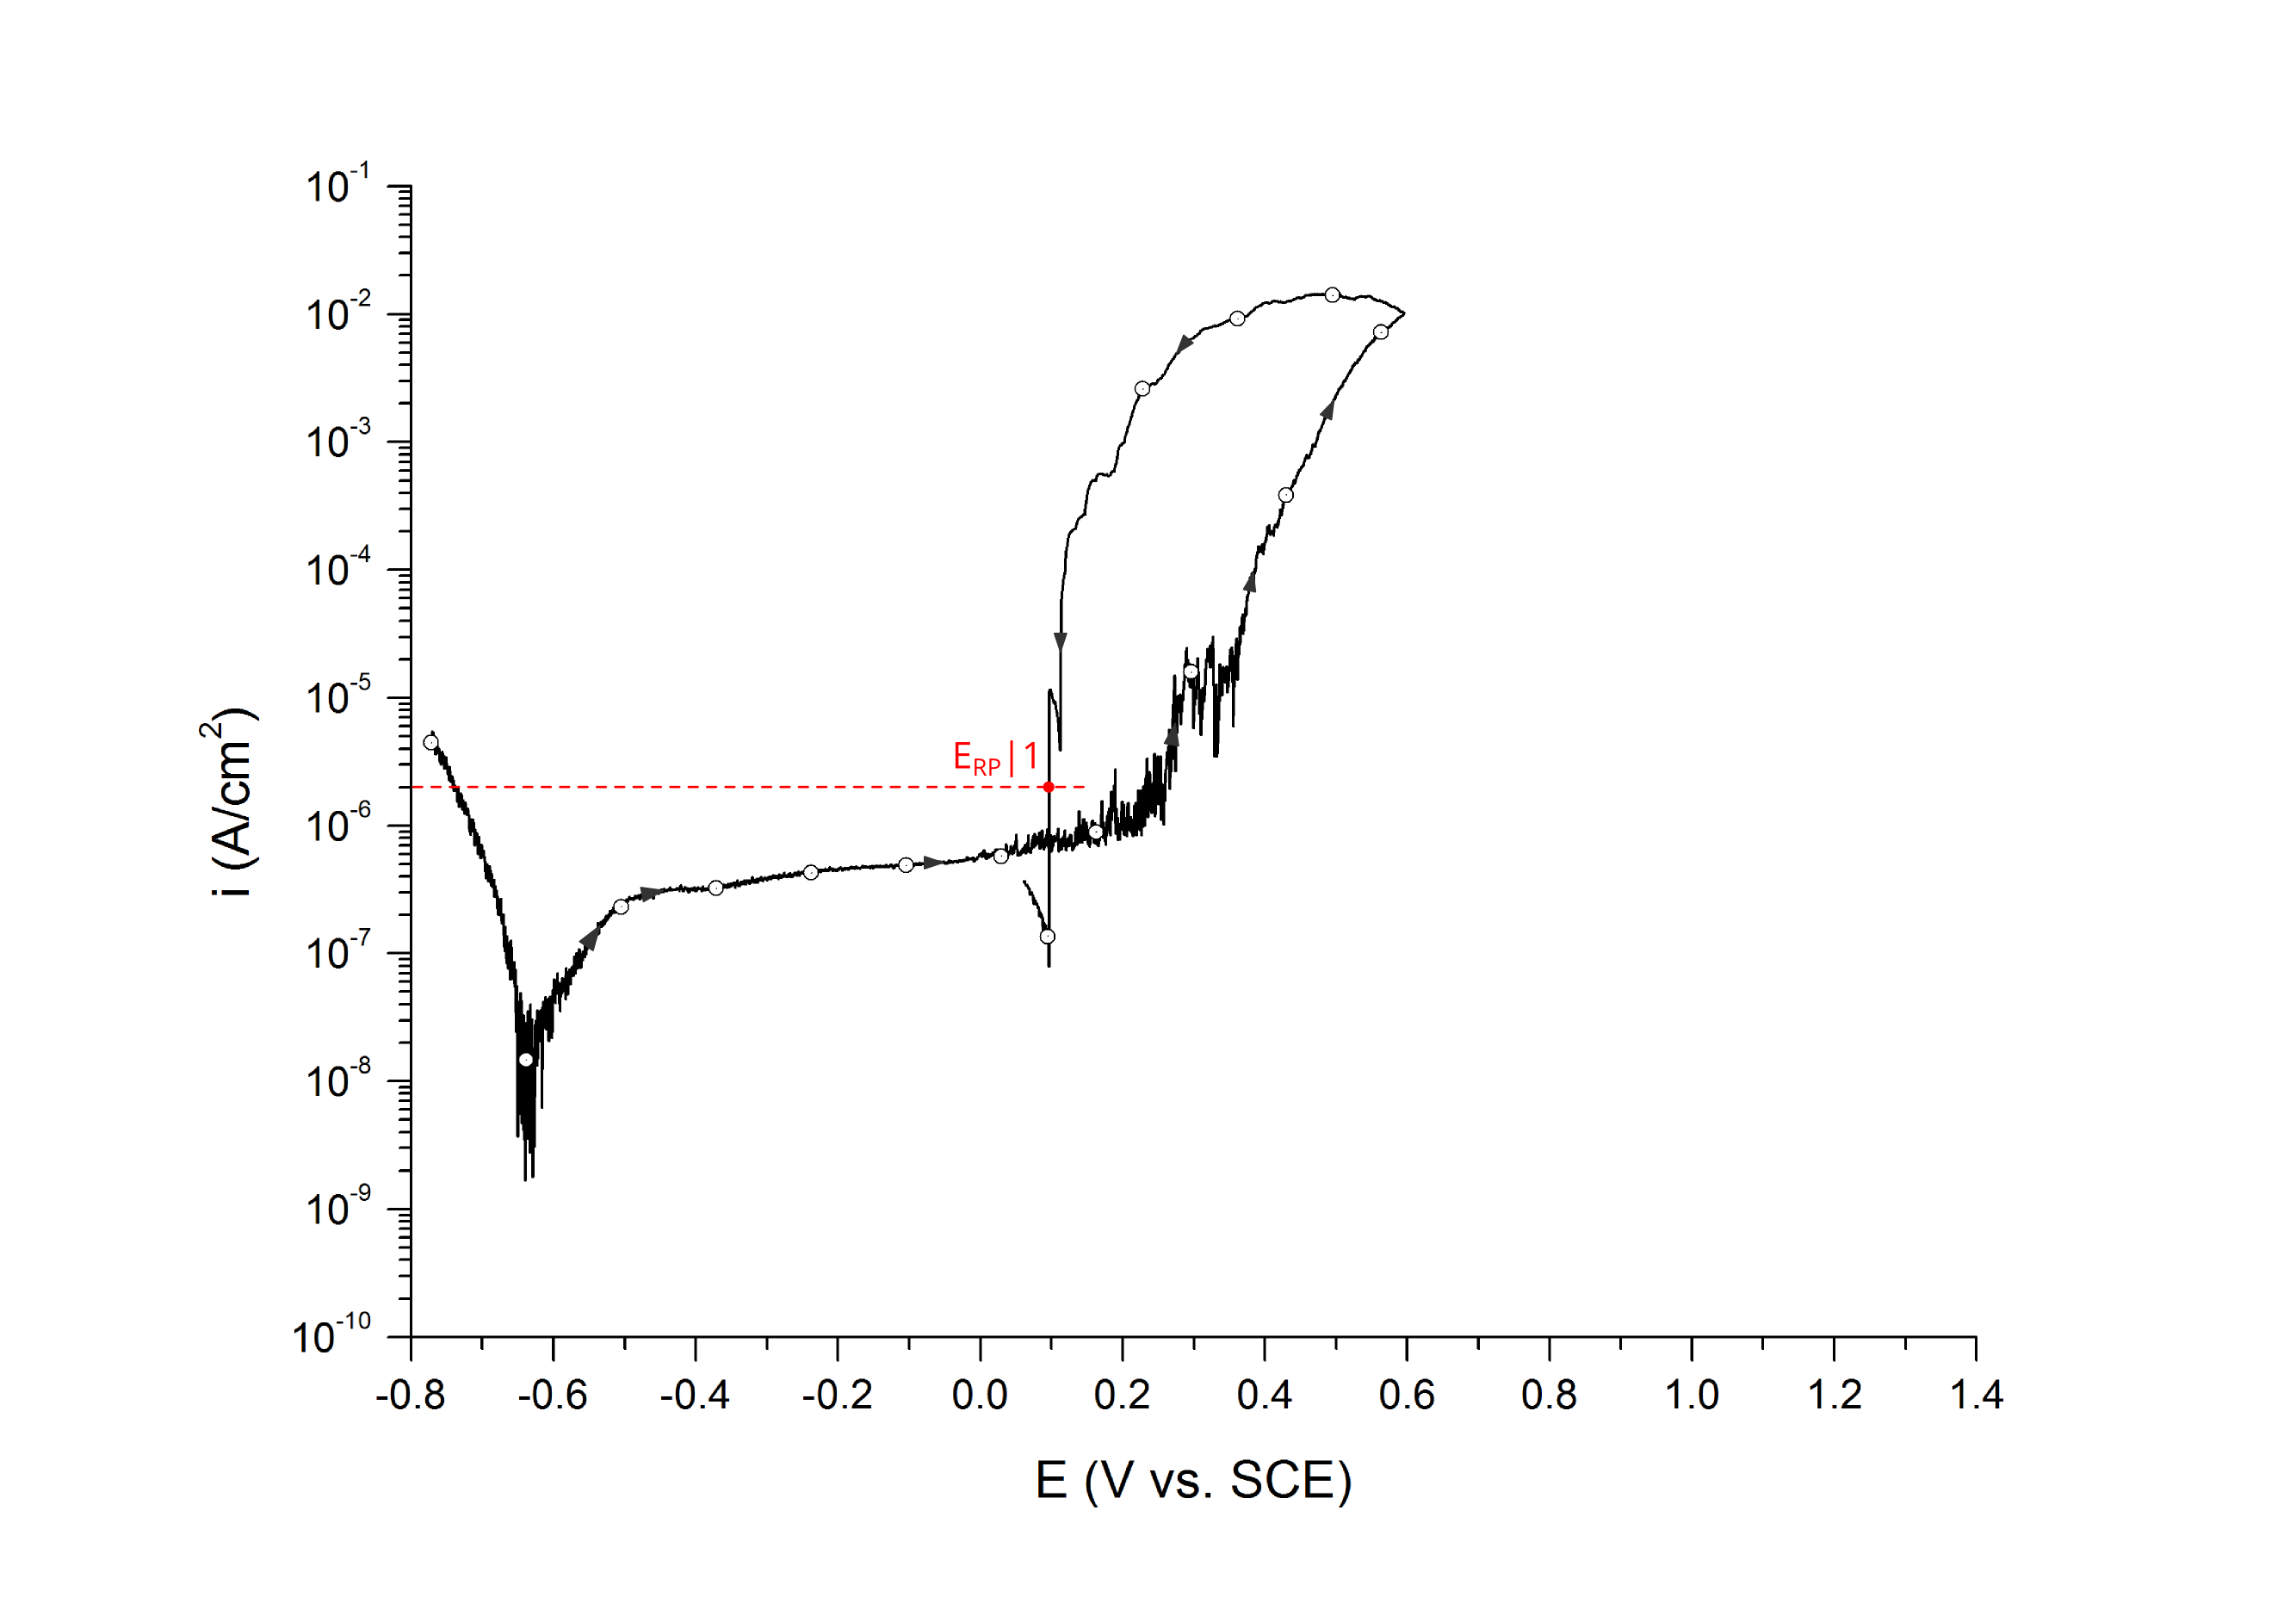
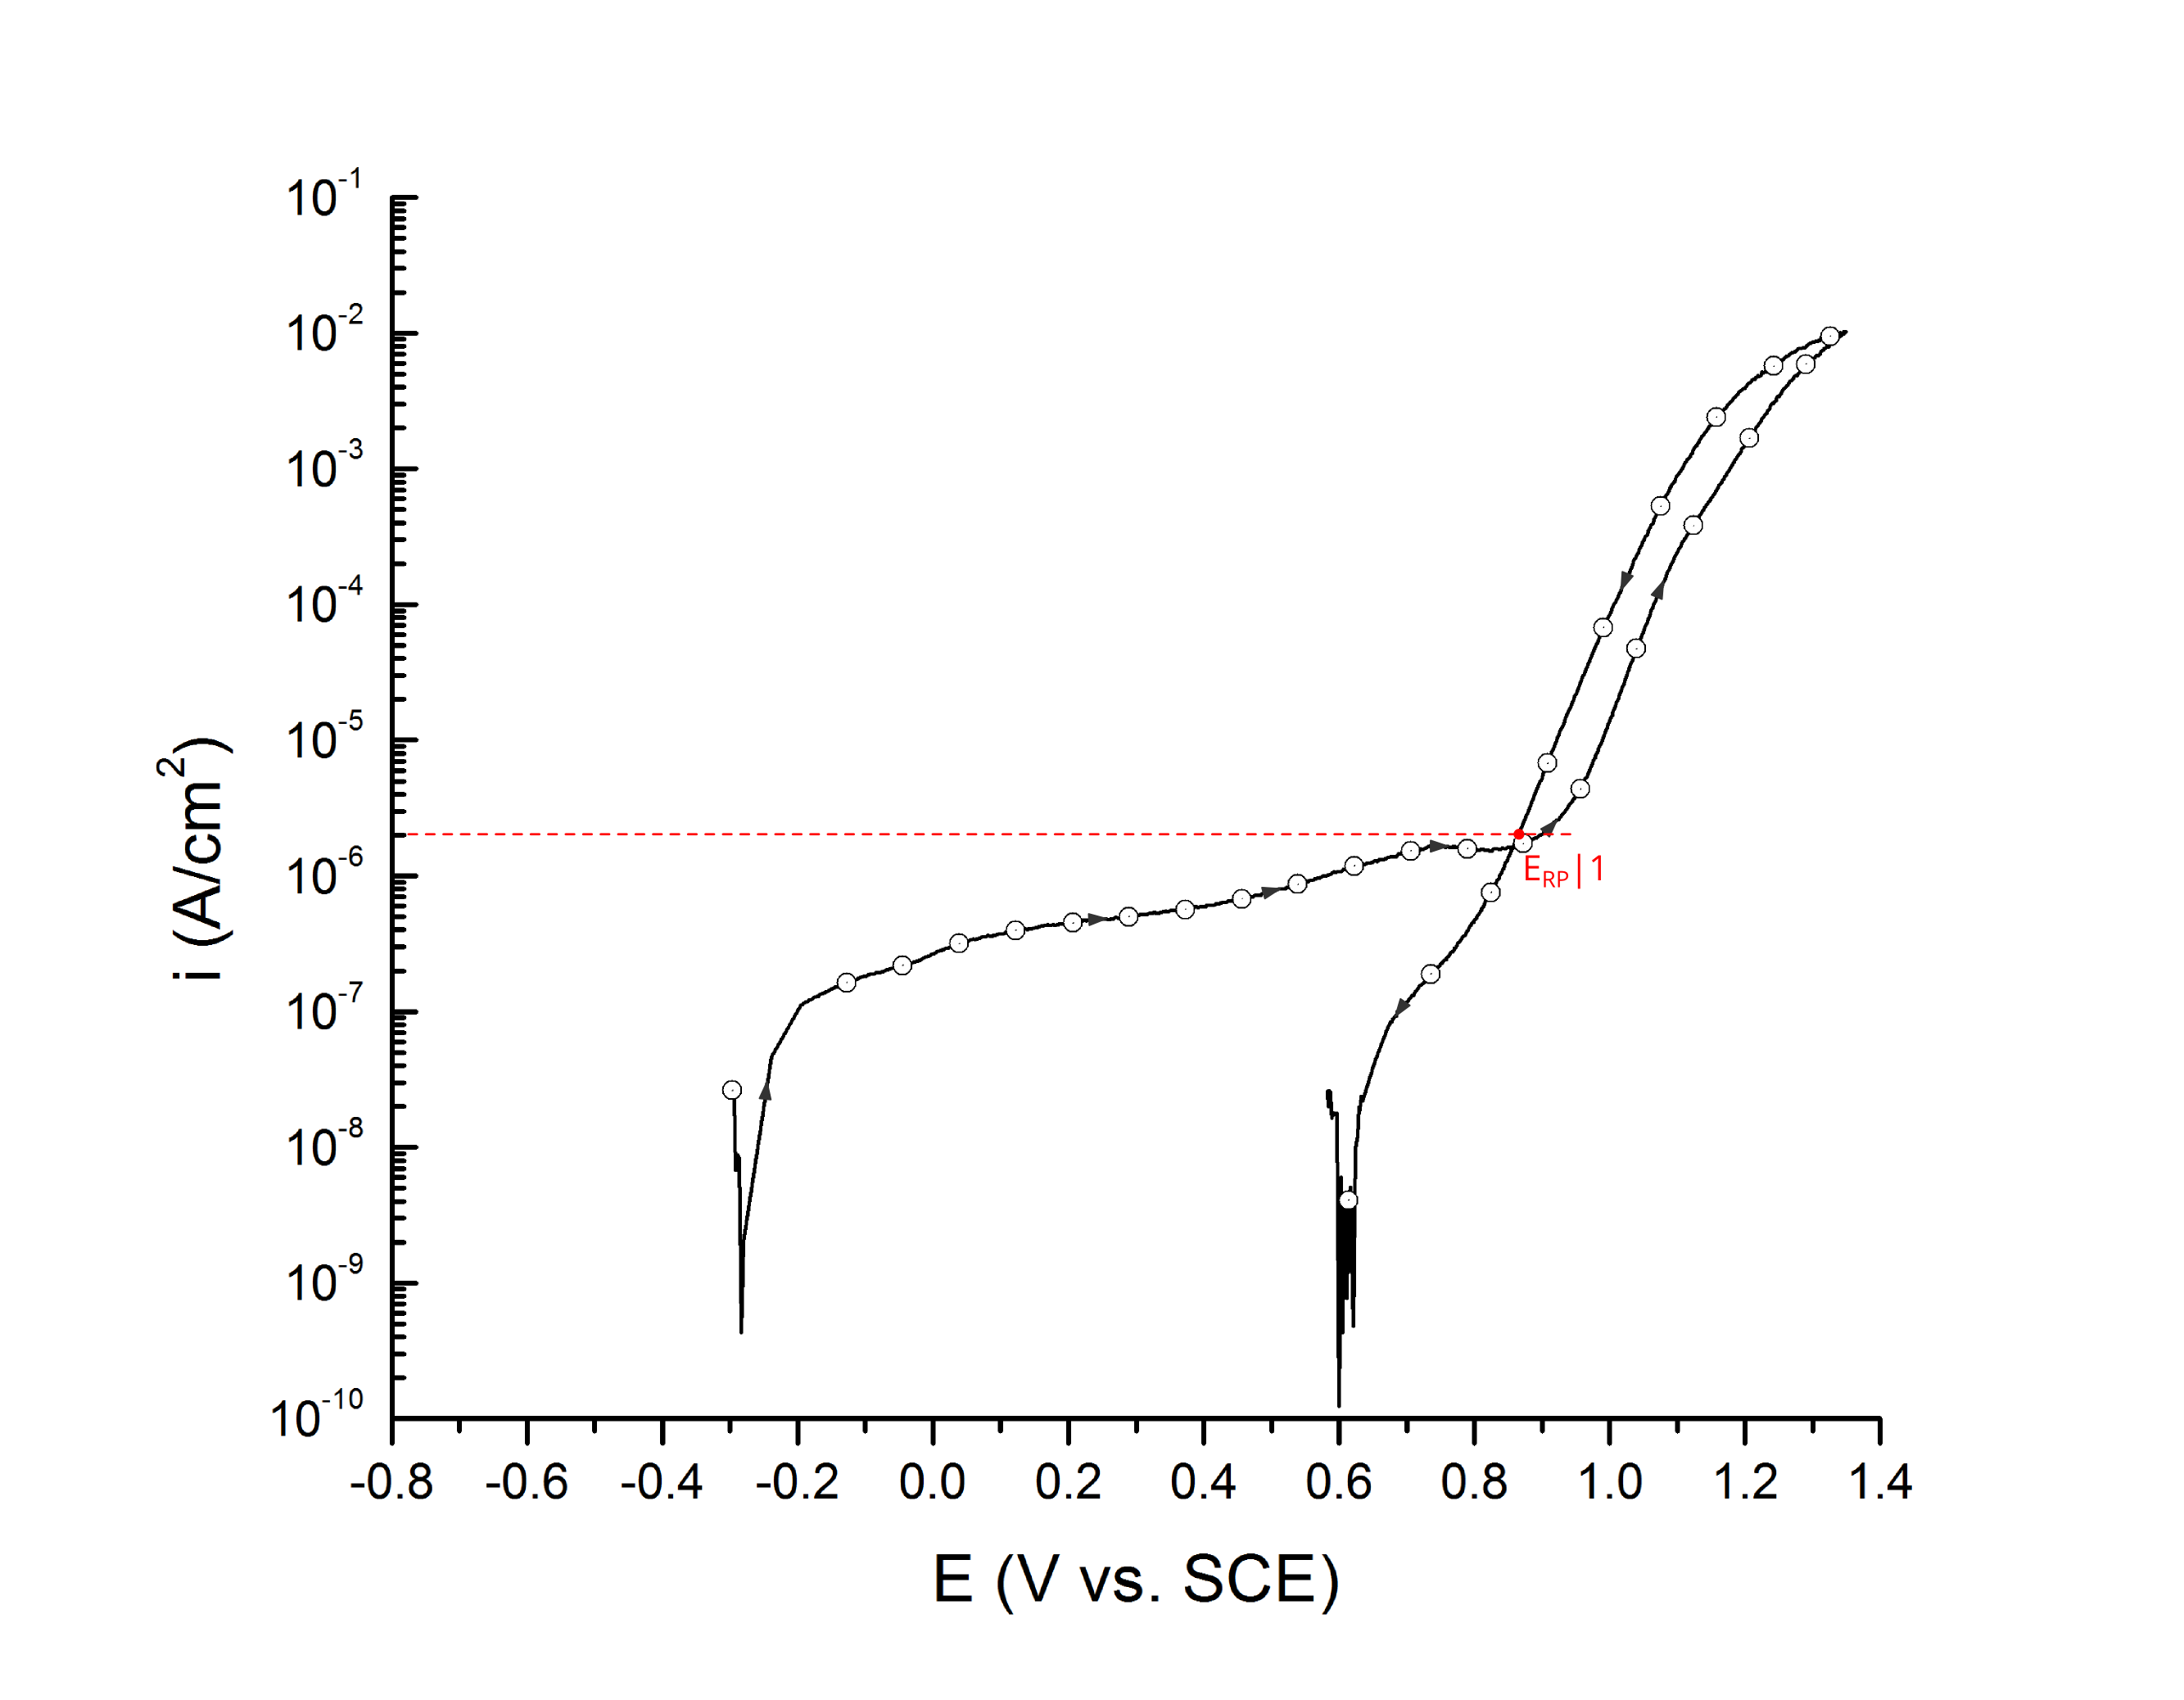
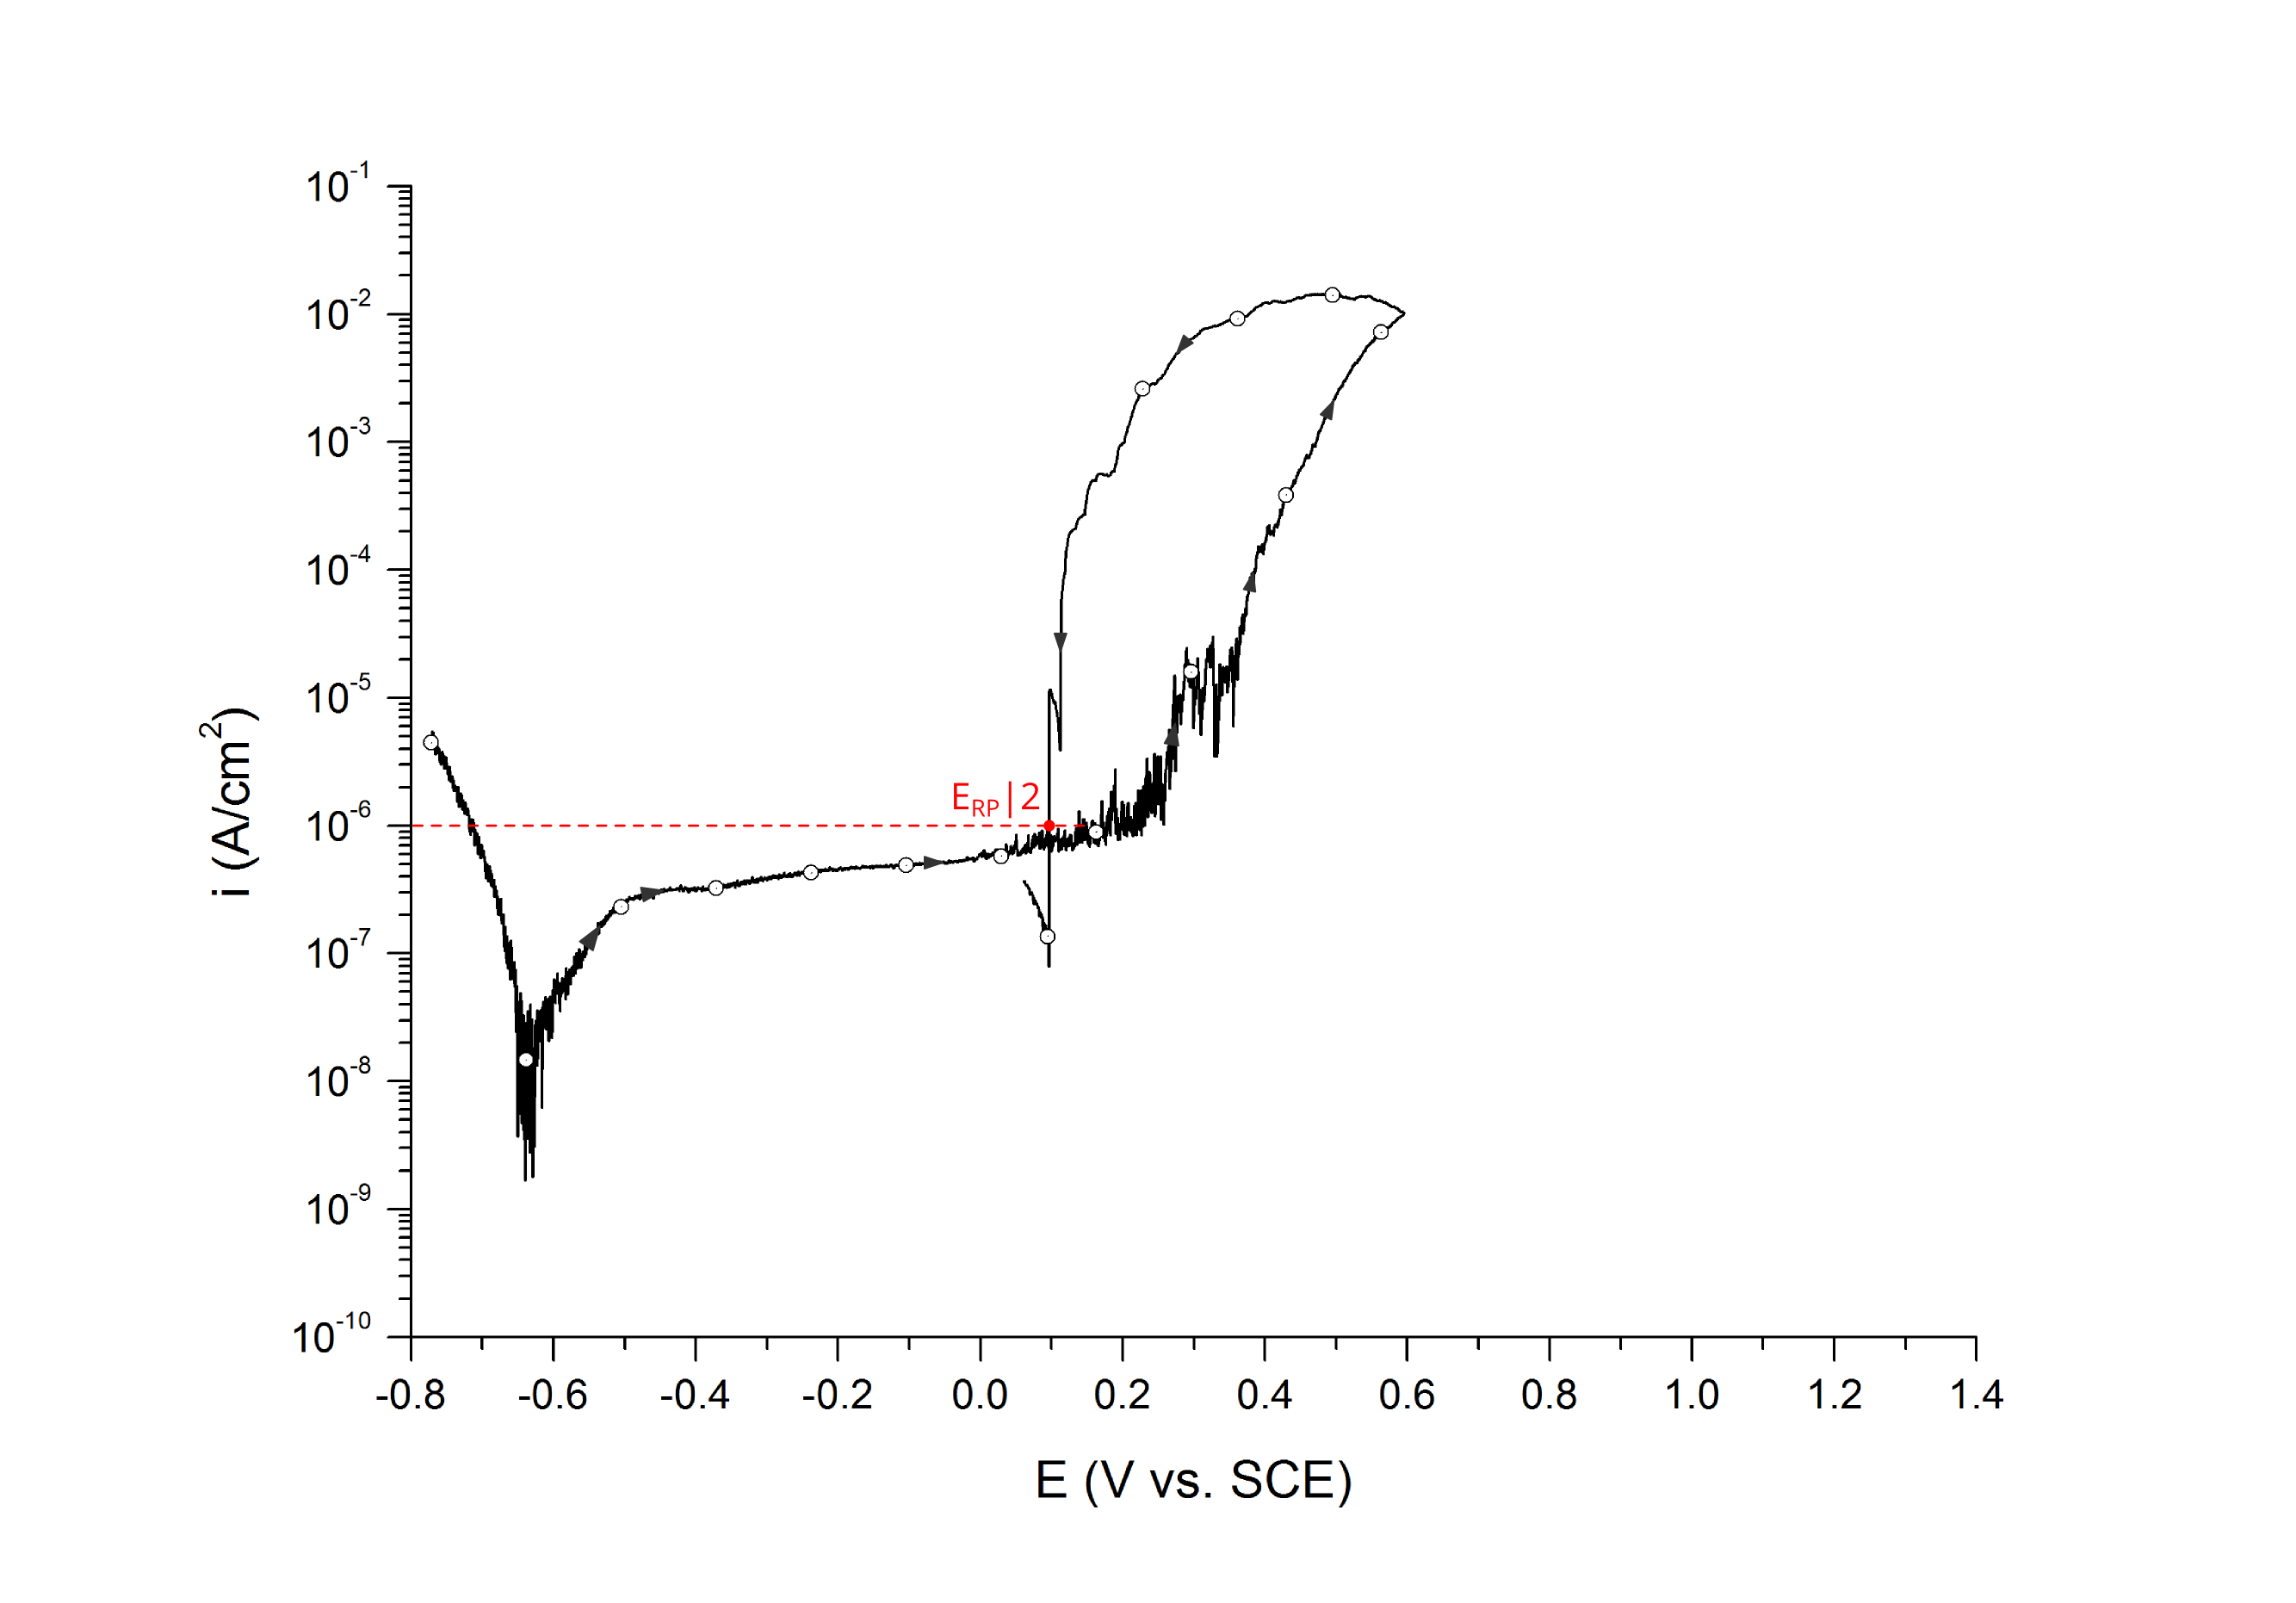
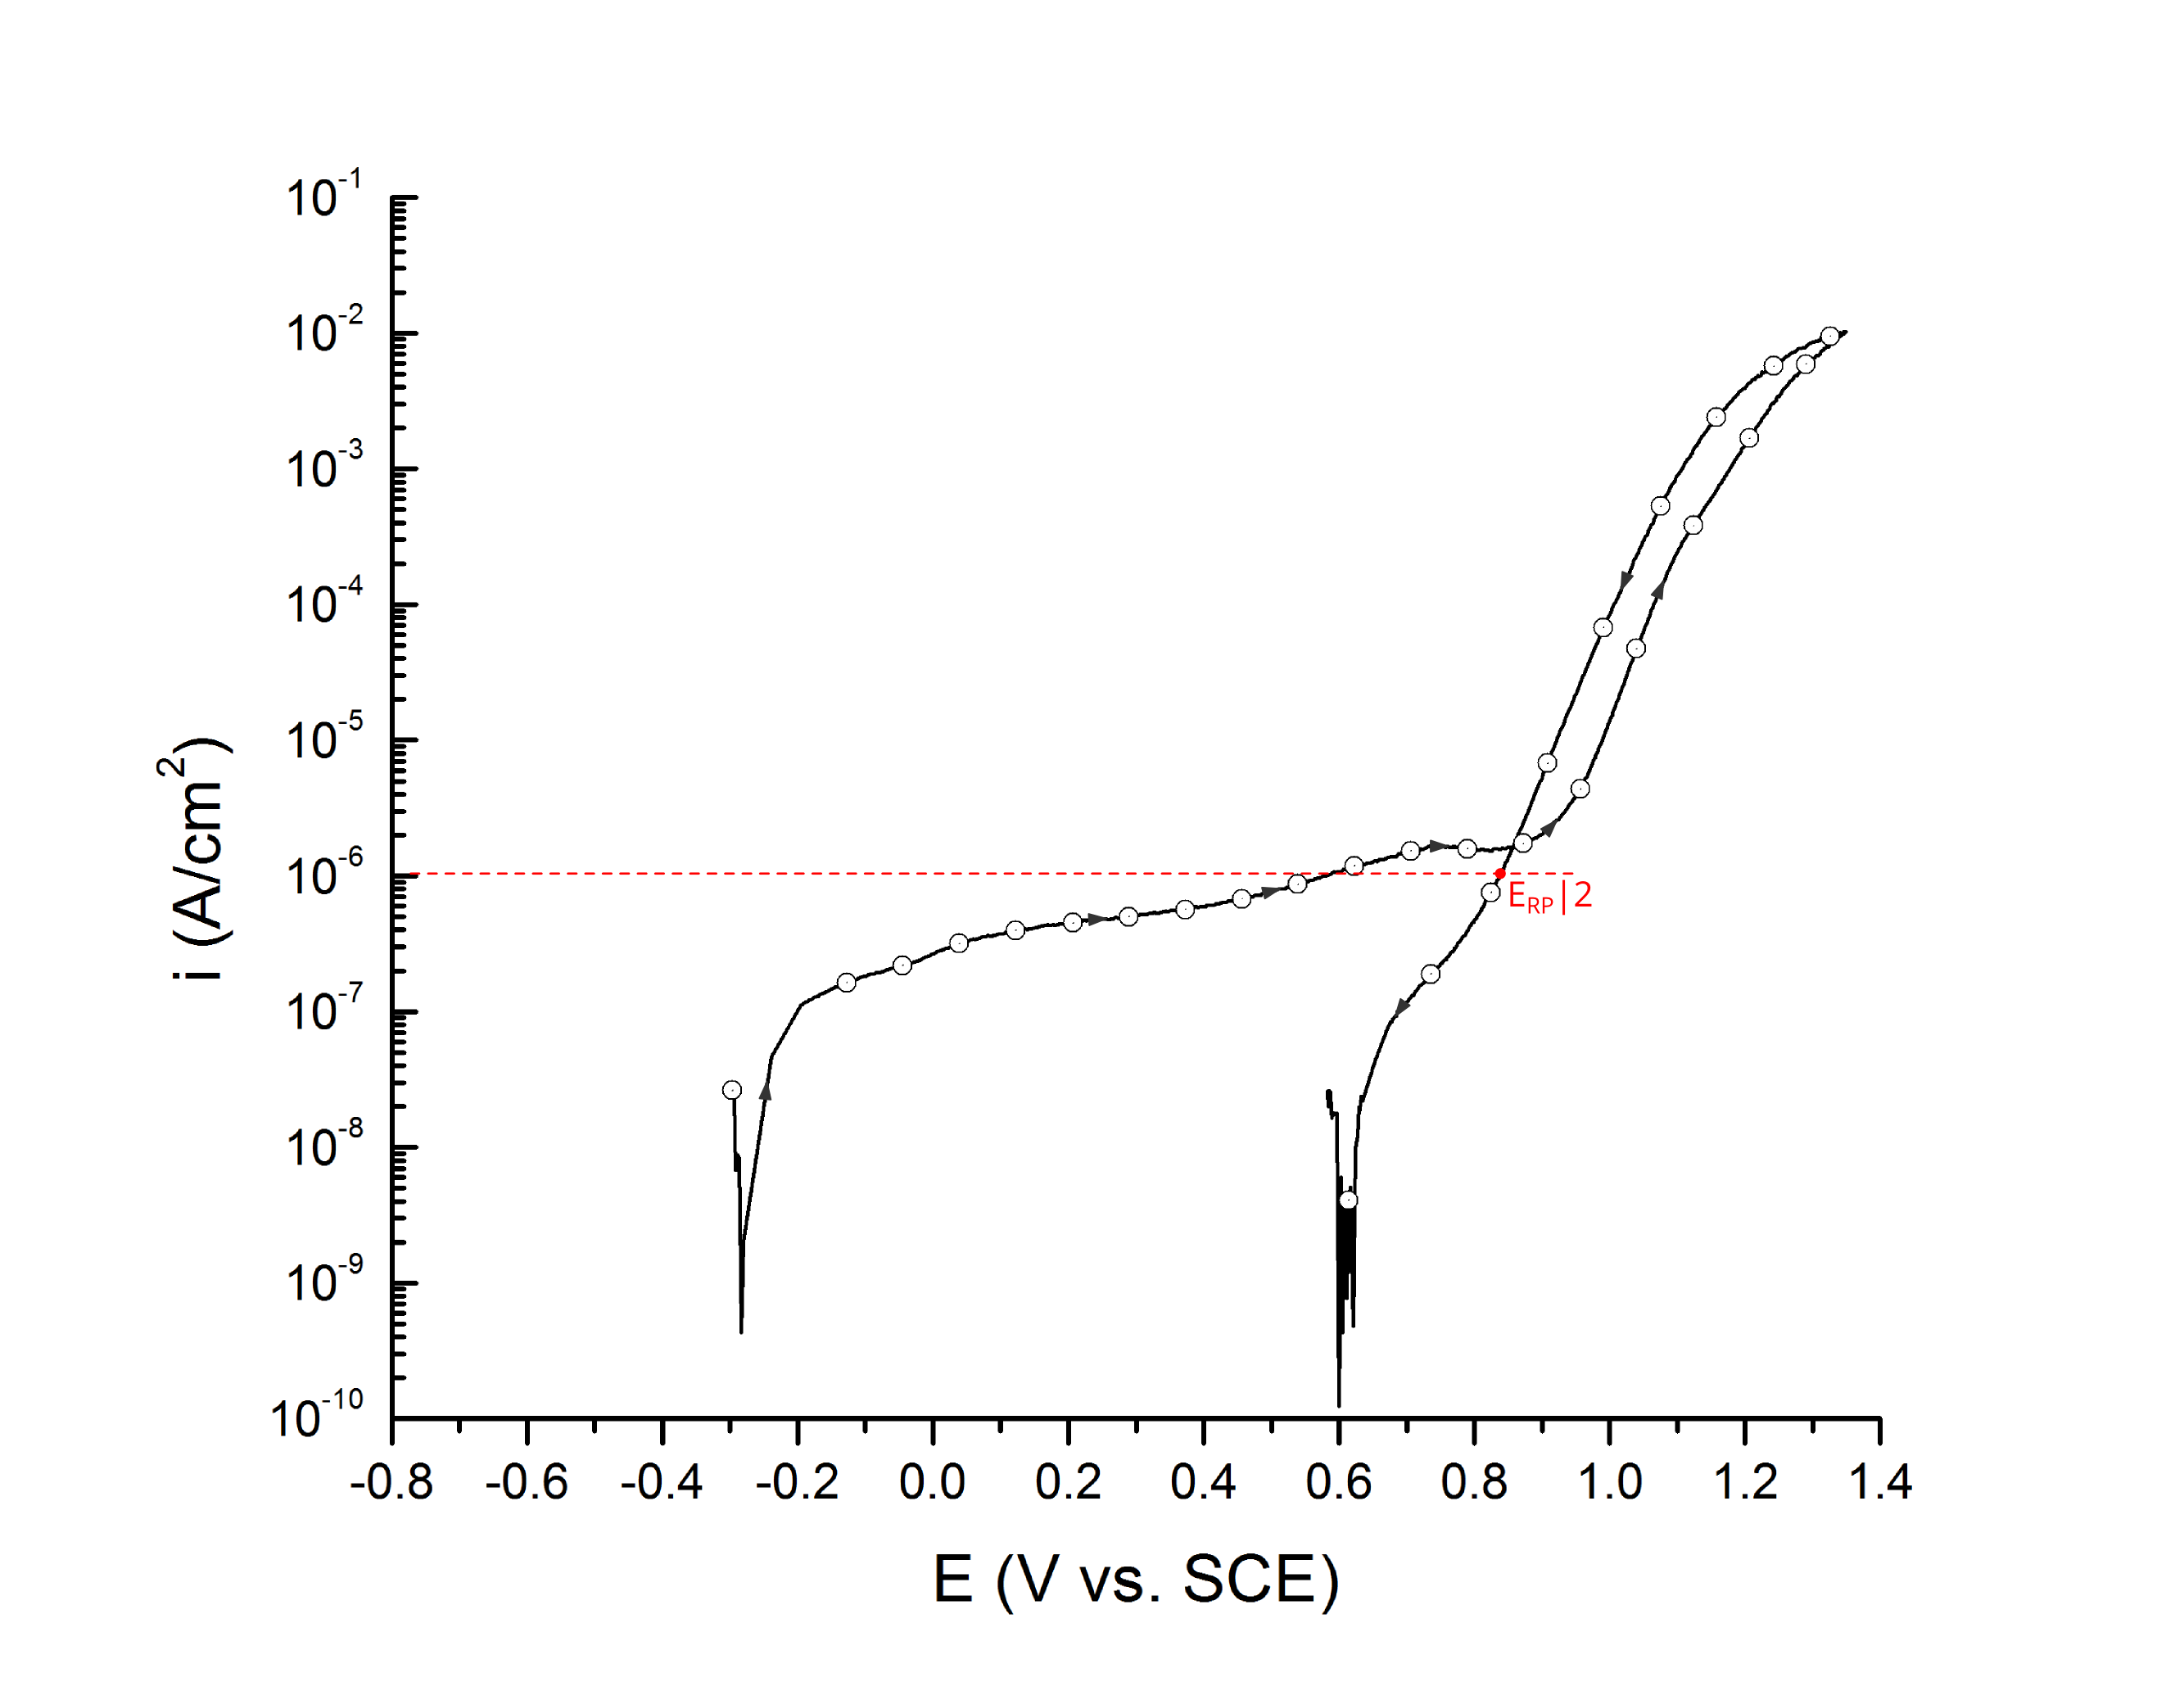
ERP can be determined as a cross-over potential 2 or a potential at an arbitrary current density 5. Cross over potentials are measured where the hysteresis loop closes, Figure 7 and Figure 8.
Sridhar et al. proposed two different repassivation potentials: i) ERP|1, which is measured at 2 μA/cm2 (Figure 9 and Figure 10) and ii) ERP|2, measured at 1 μA/cm2 (Figure 11 and Figure 12) 5.
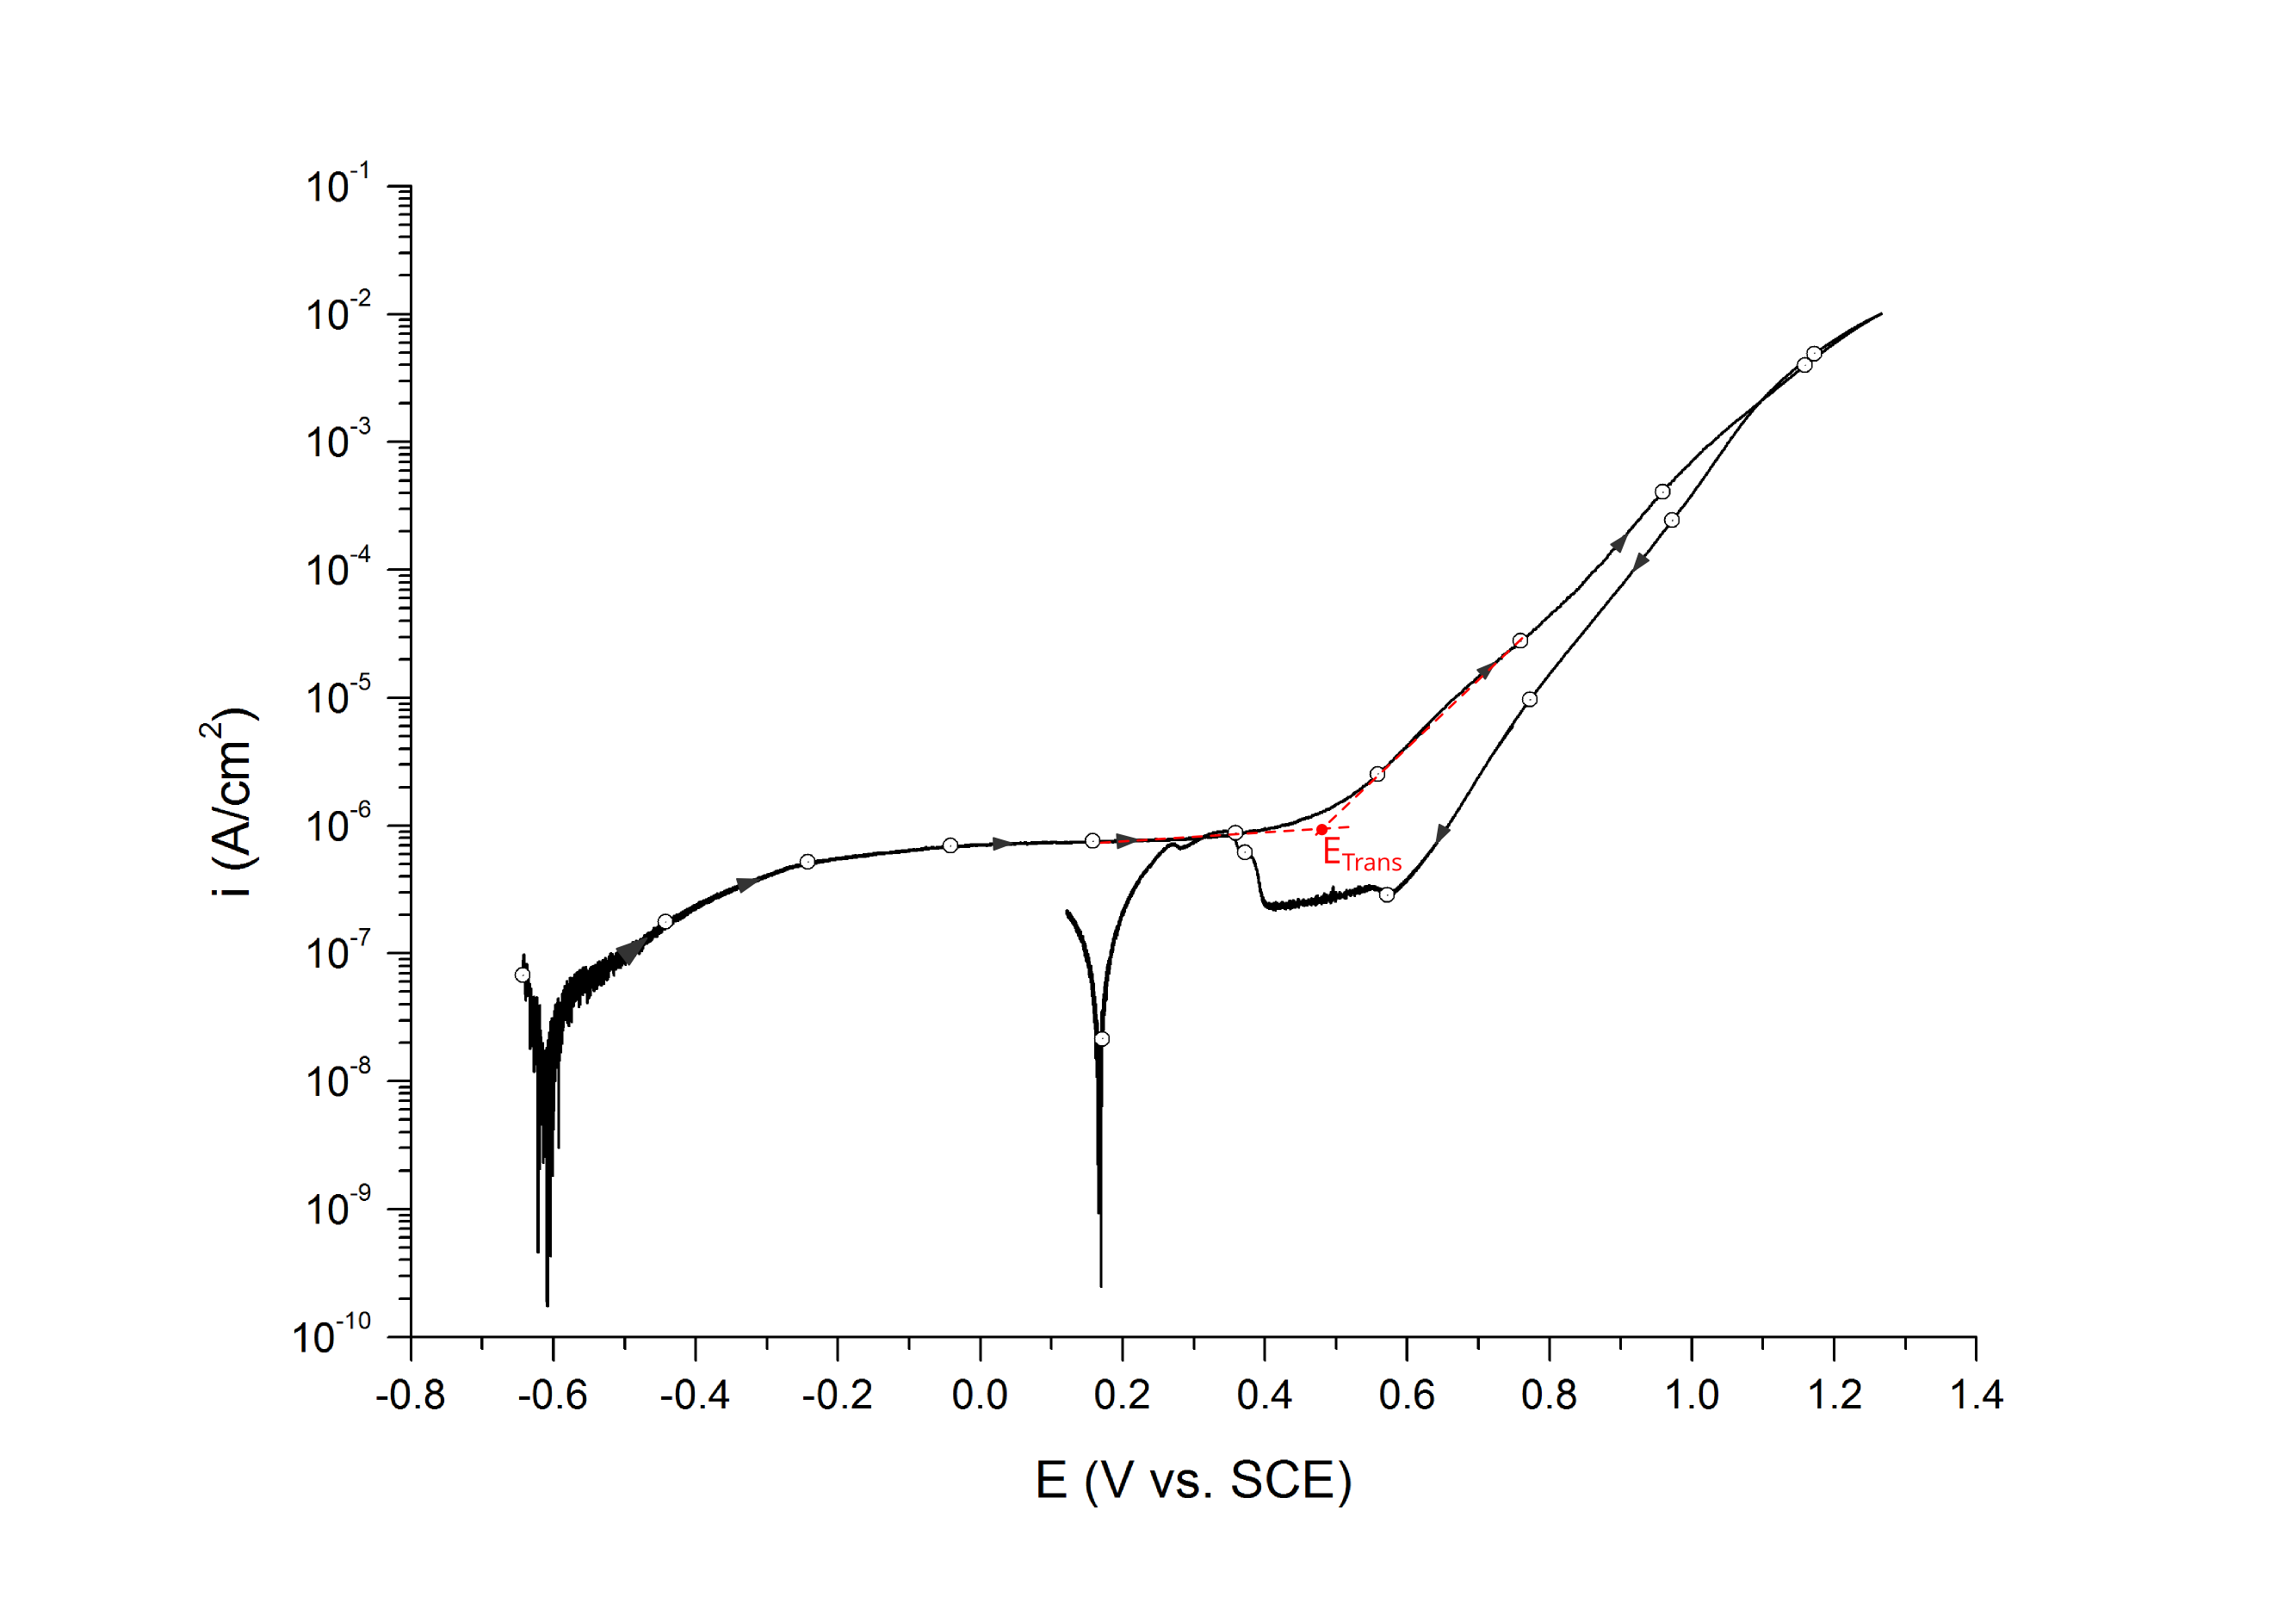
Transpassivity
Transpassive potentials are also associated with a sharp increase in current. Above ETrans the current increases due to i) dissolution of the passive film and ii) oxygen evolution (i.e. water oxidation) without pitting corrosion. ETrans is typically determined at the inflection point, Figure 13.
Multiple pitting potentials
Highly heterogeneous alloys, such as high strength aluminum alloys, often show two distinctive pitting potentials (e.g. EP1 and EP2). These pitting potentials are associated with the dissolution of different active phases before pitting corrosion of the matrix 6. In this case, the multiple pitting potentials are determined at the first and second inflection points, respectively (Figure 14).
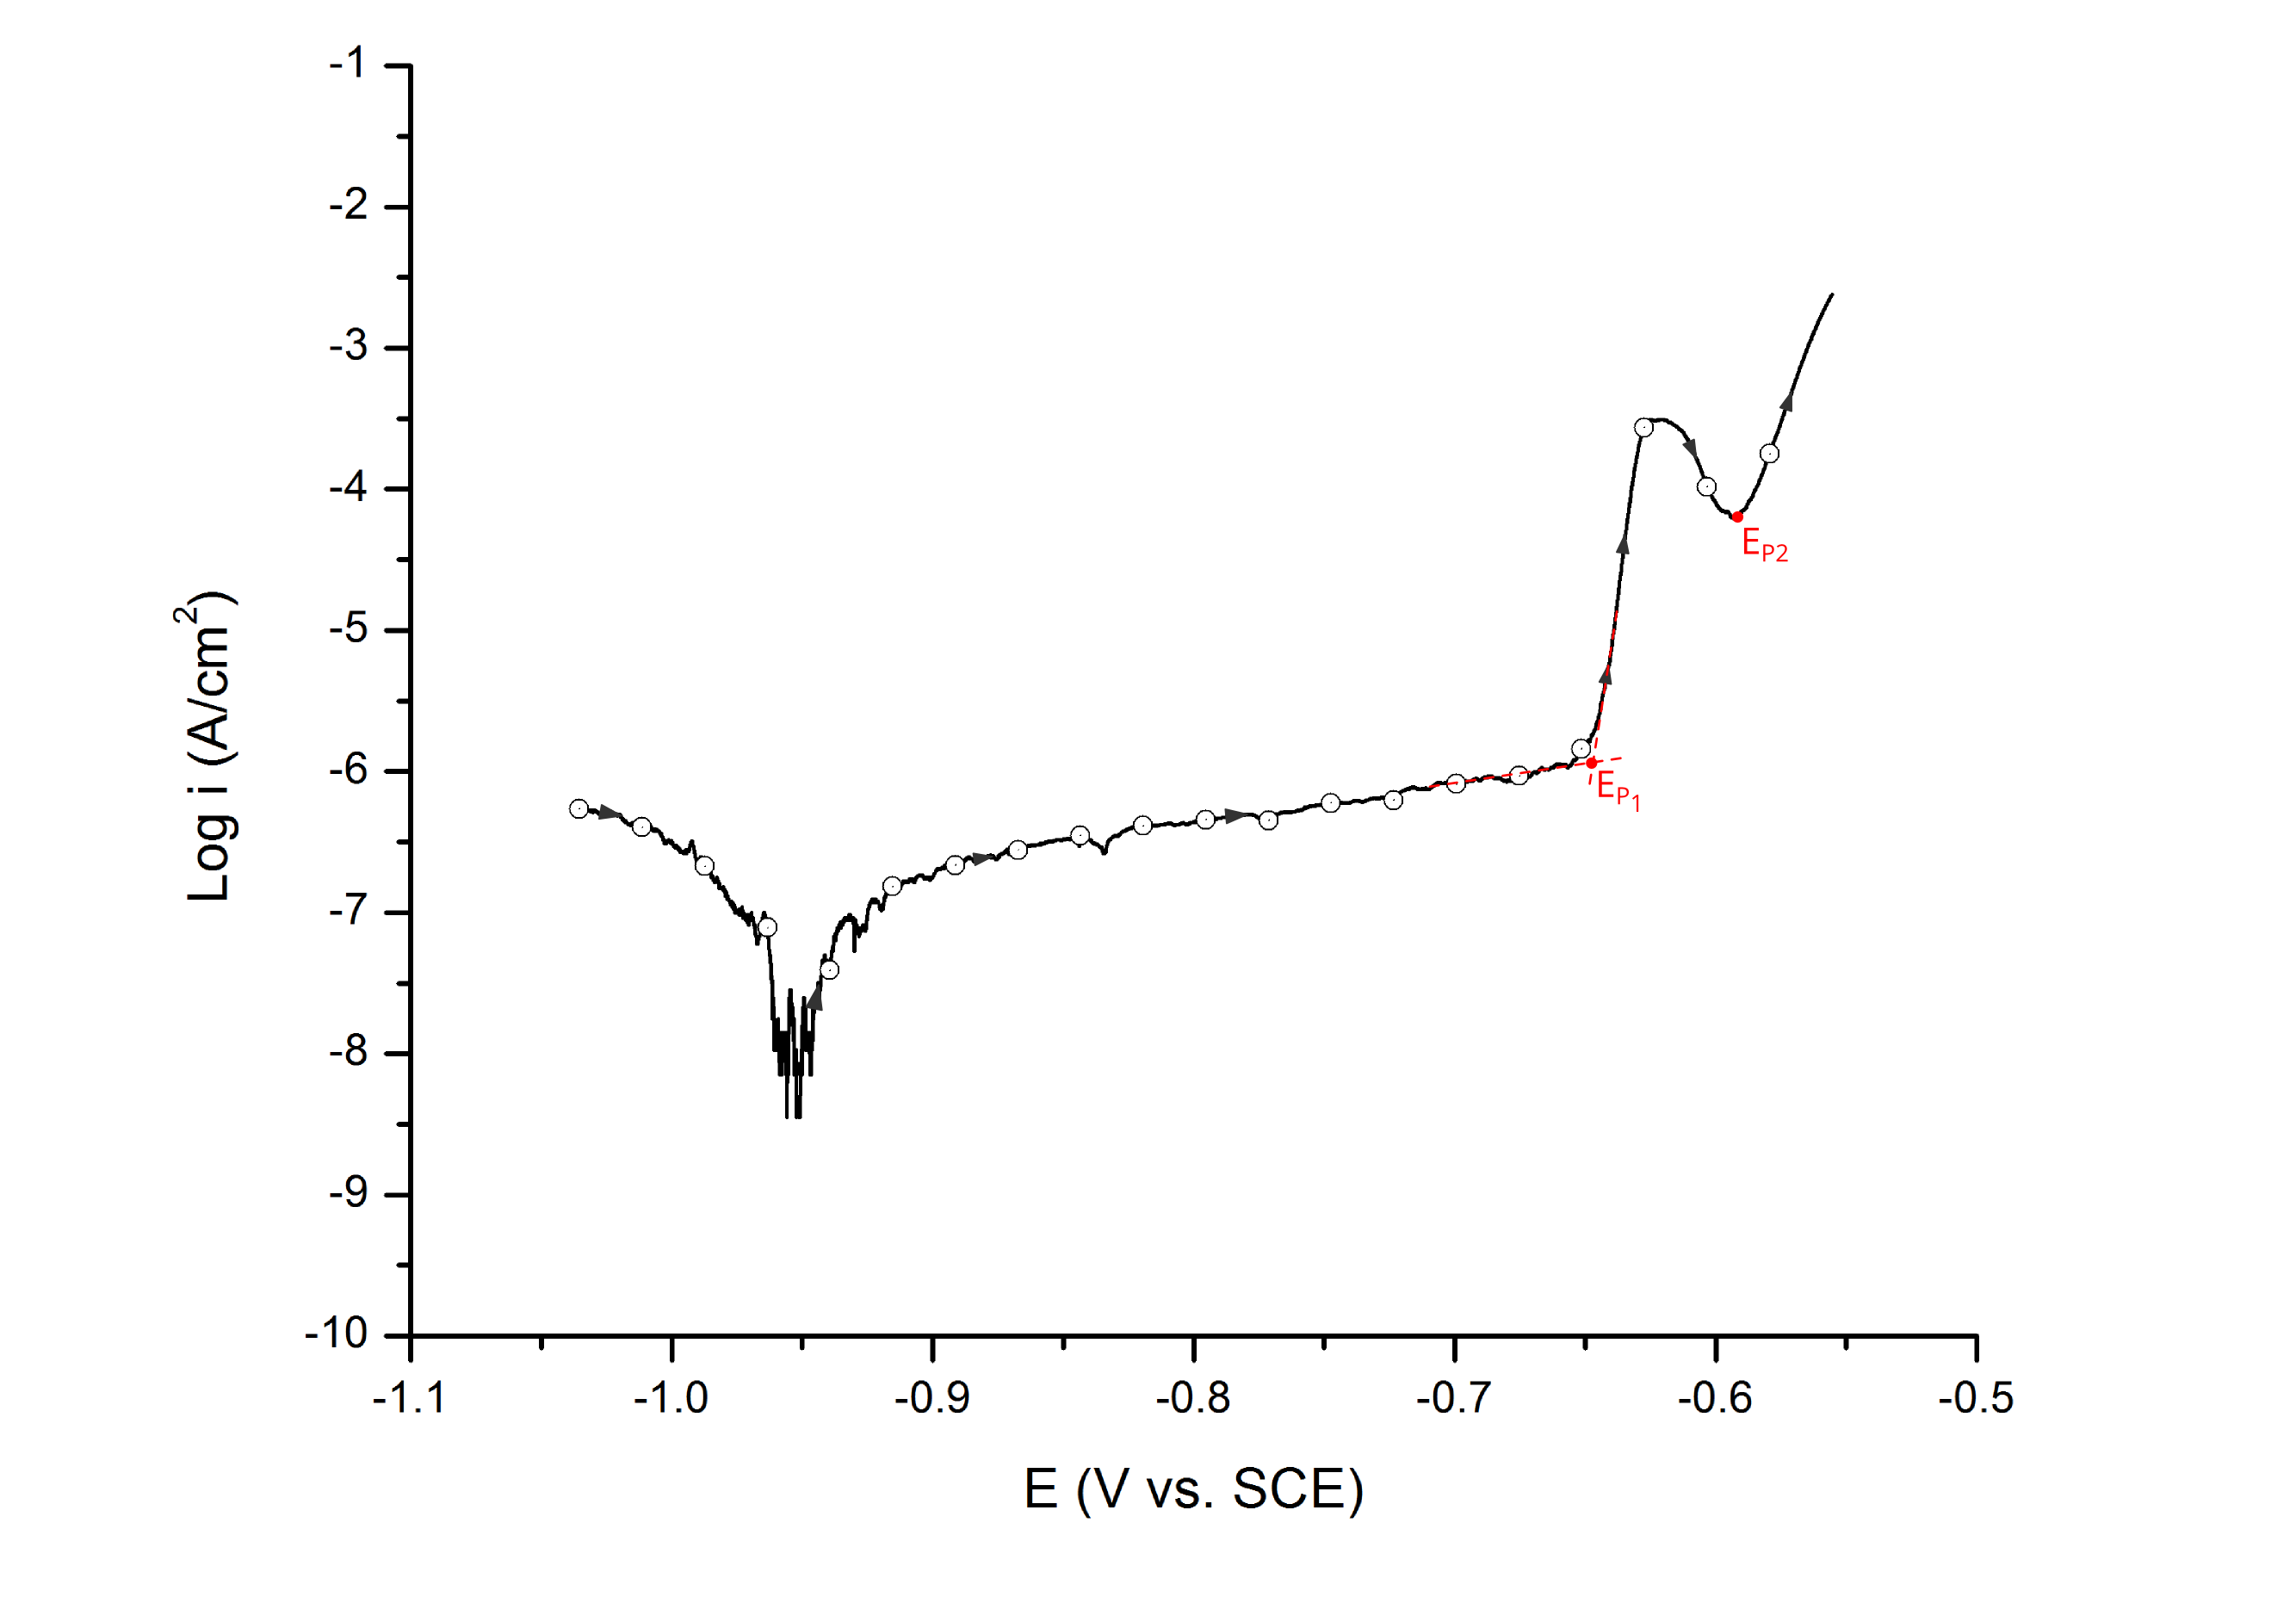
For UNS A92024 (AA2024-T3), the first pitting potential has been associated with the dissolution of S-phase (Al2CuMg) particles, which are anodic to the surrounding aluminum matrix 6.
References
- G.S. Frankel, “Pitting Corrosion”, ASM Handbook Vol. 13A, (ASM International, Metals Park, OH, 2003): p.237.
- R Baboian and G.S. Haynes, “Cyclic Polarization Measurements – Experimental Procedures and Evaluation of Test Data”, STP 727 Electrochemical Corrosion Testing, (ASTM, Philadelphia, PA, 1981): p. 274–282.
- V.M. Salinas-Bravo and R. C. Newman, Corr. Sci. 36, (1994): p.67–77.
- J.R. Scully, N.D. Budiansky, Y. Tiwary, A.S. Mikhailov c, J.L. Hudson, “An alternate explanation for the abrupt current increase at the pitting potential”, Corr. Sci. 50 (2008): p.316–324
- N. Sridhar, C.S. Brossia, D.S. Dunn, A. Anderko, Corrosion 60, (2004): p.915–936.
- M. Iannuzzi, J. Kovak, G.S. Frankel, Electrochim. Acta 52 (2007): p.4032–4042.